

Introduction: The Challenge of Understanding Infrastructure

In today’s cloud-native world, systems communicate with each other more than ever, across regions, services, and networks. Yet when something goes wrong, the question always remains: “Where exactly did it fail?”
Even with logs, APMs, and dashboards, understanding how everything is actually connected, which service depends on which, or which port suddenly stopped responding, often stays hidden. That’s the gap Parny InfraMap aims to close.
What Is Parny InfraMap? (Features & Architecture)
Parny InfraMap is a real-time network visualization and dependency mapping tool that helps teams see every connection inside their infrastructure, not just the ones they manually configured.
At its core, InfraMap runs lightweight agents across your environments, including Linux, Windows, and macOS, to capture and analyze live network traffic over TCP, UDP, and ICMP.
Each agent detects source and destination IPs, ports, hostnames, and protocols, then securely streams that data (using API key authentication) to the Parny Portal.
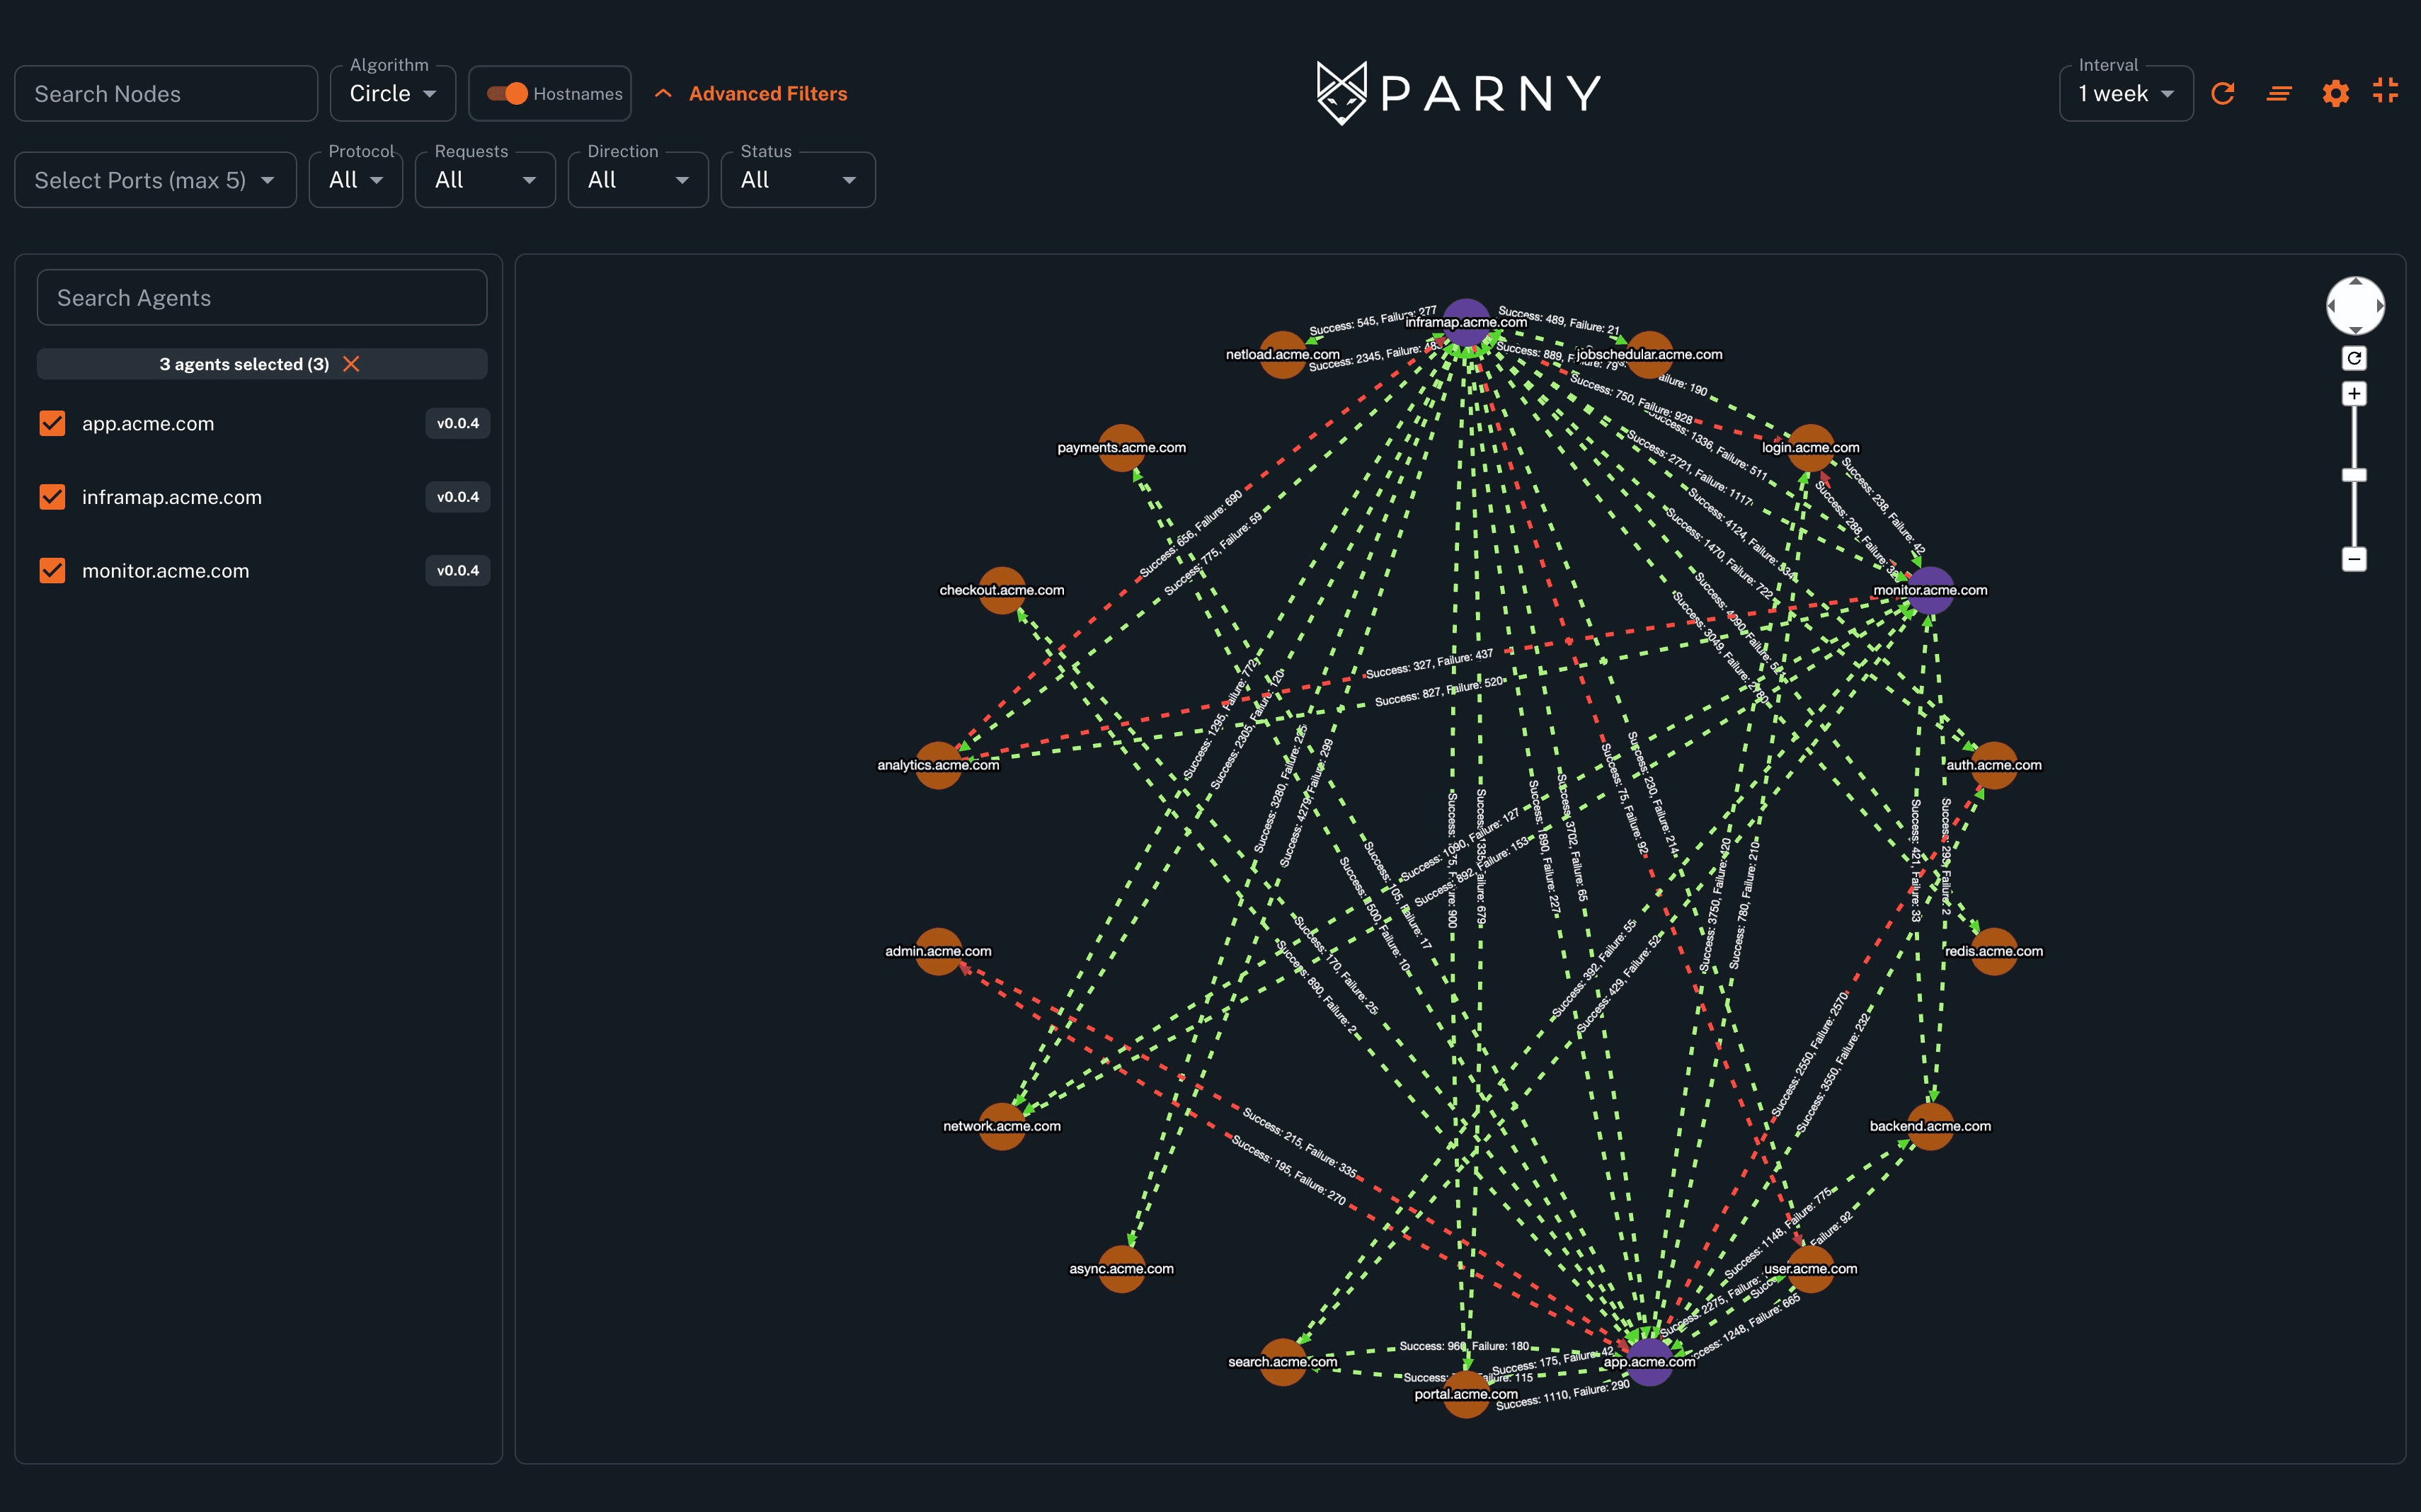
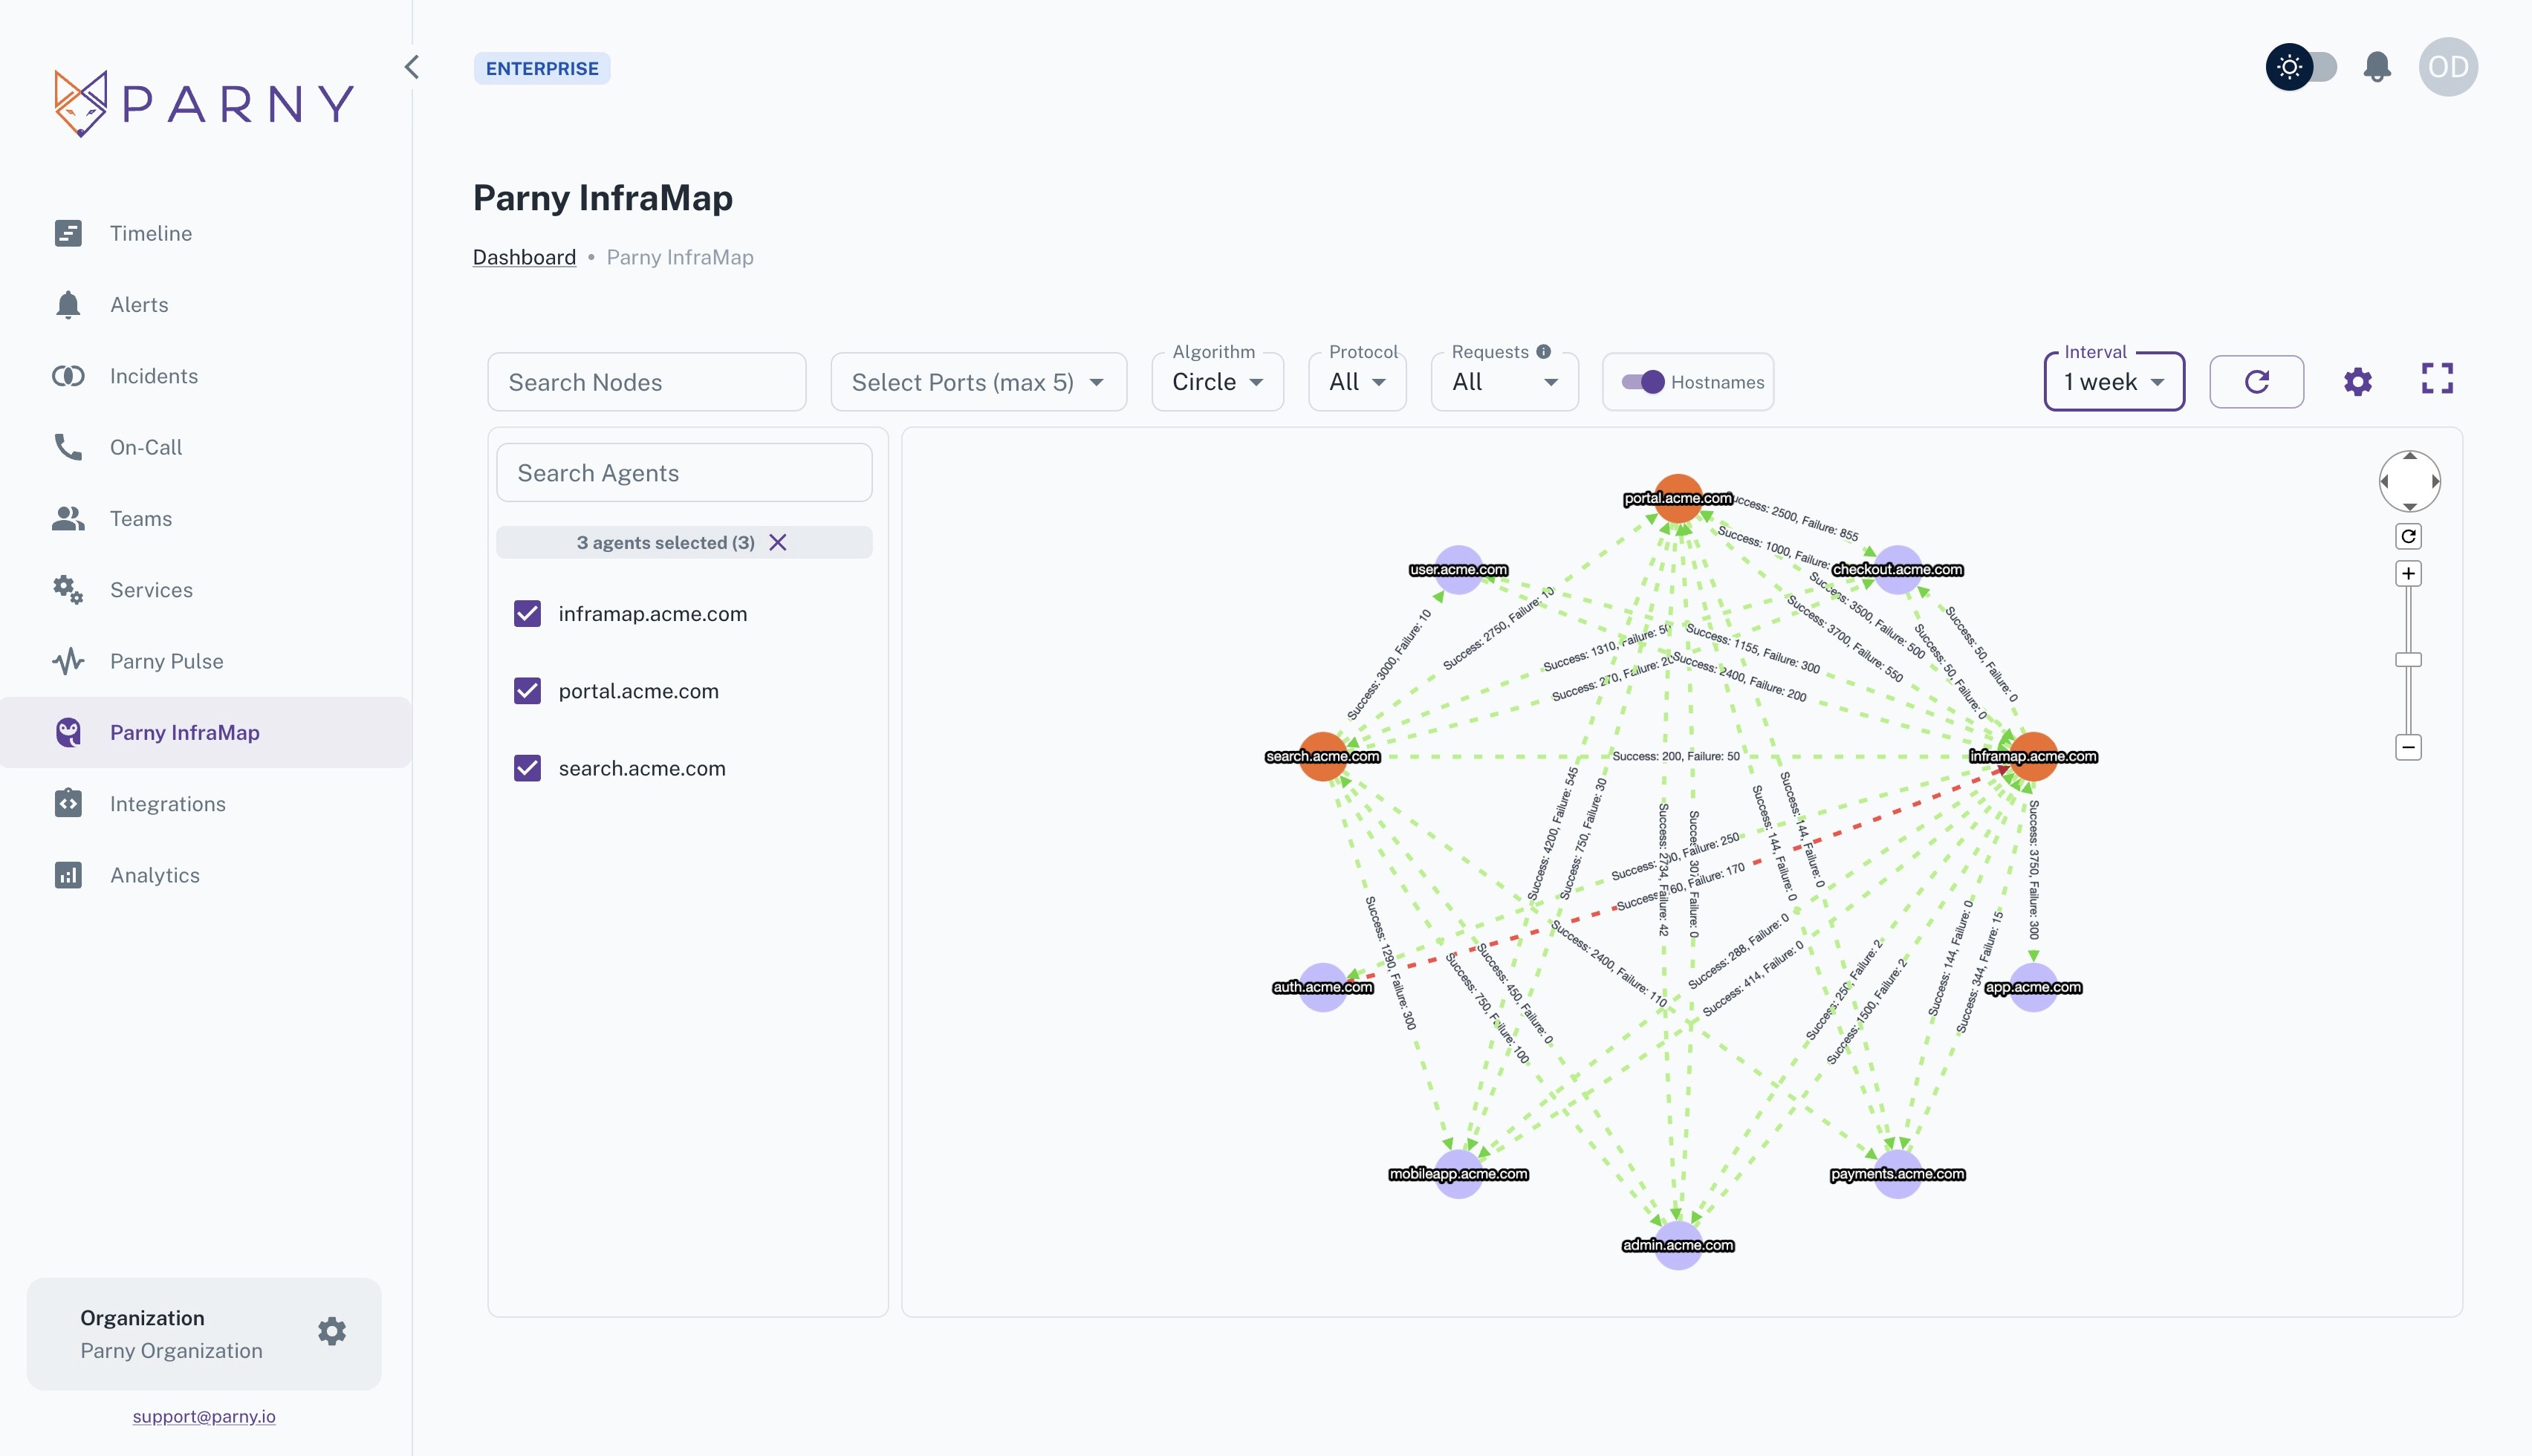
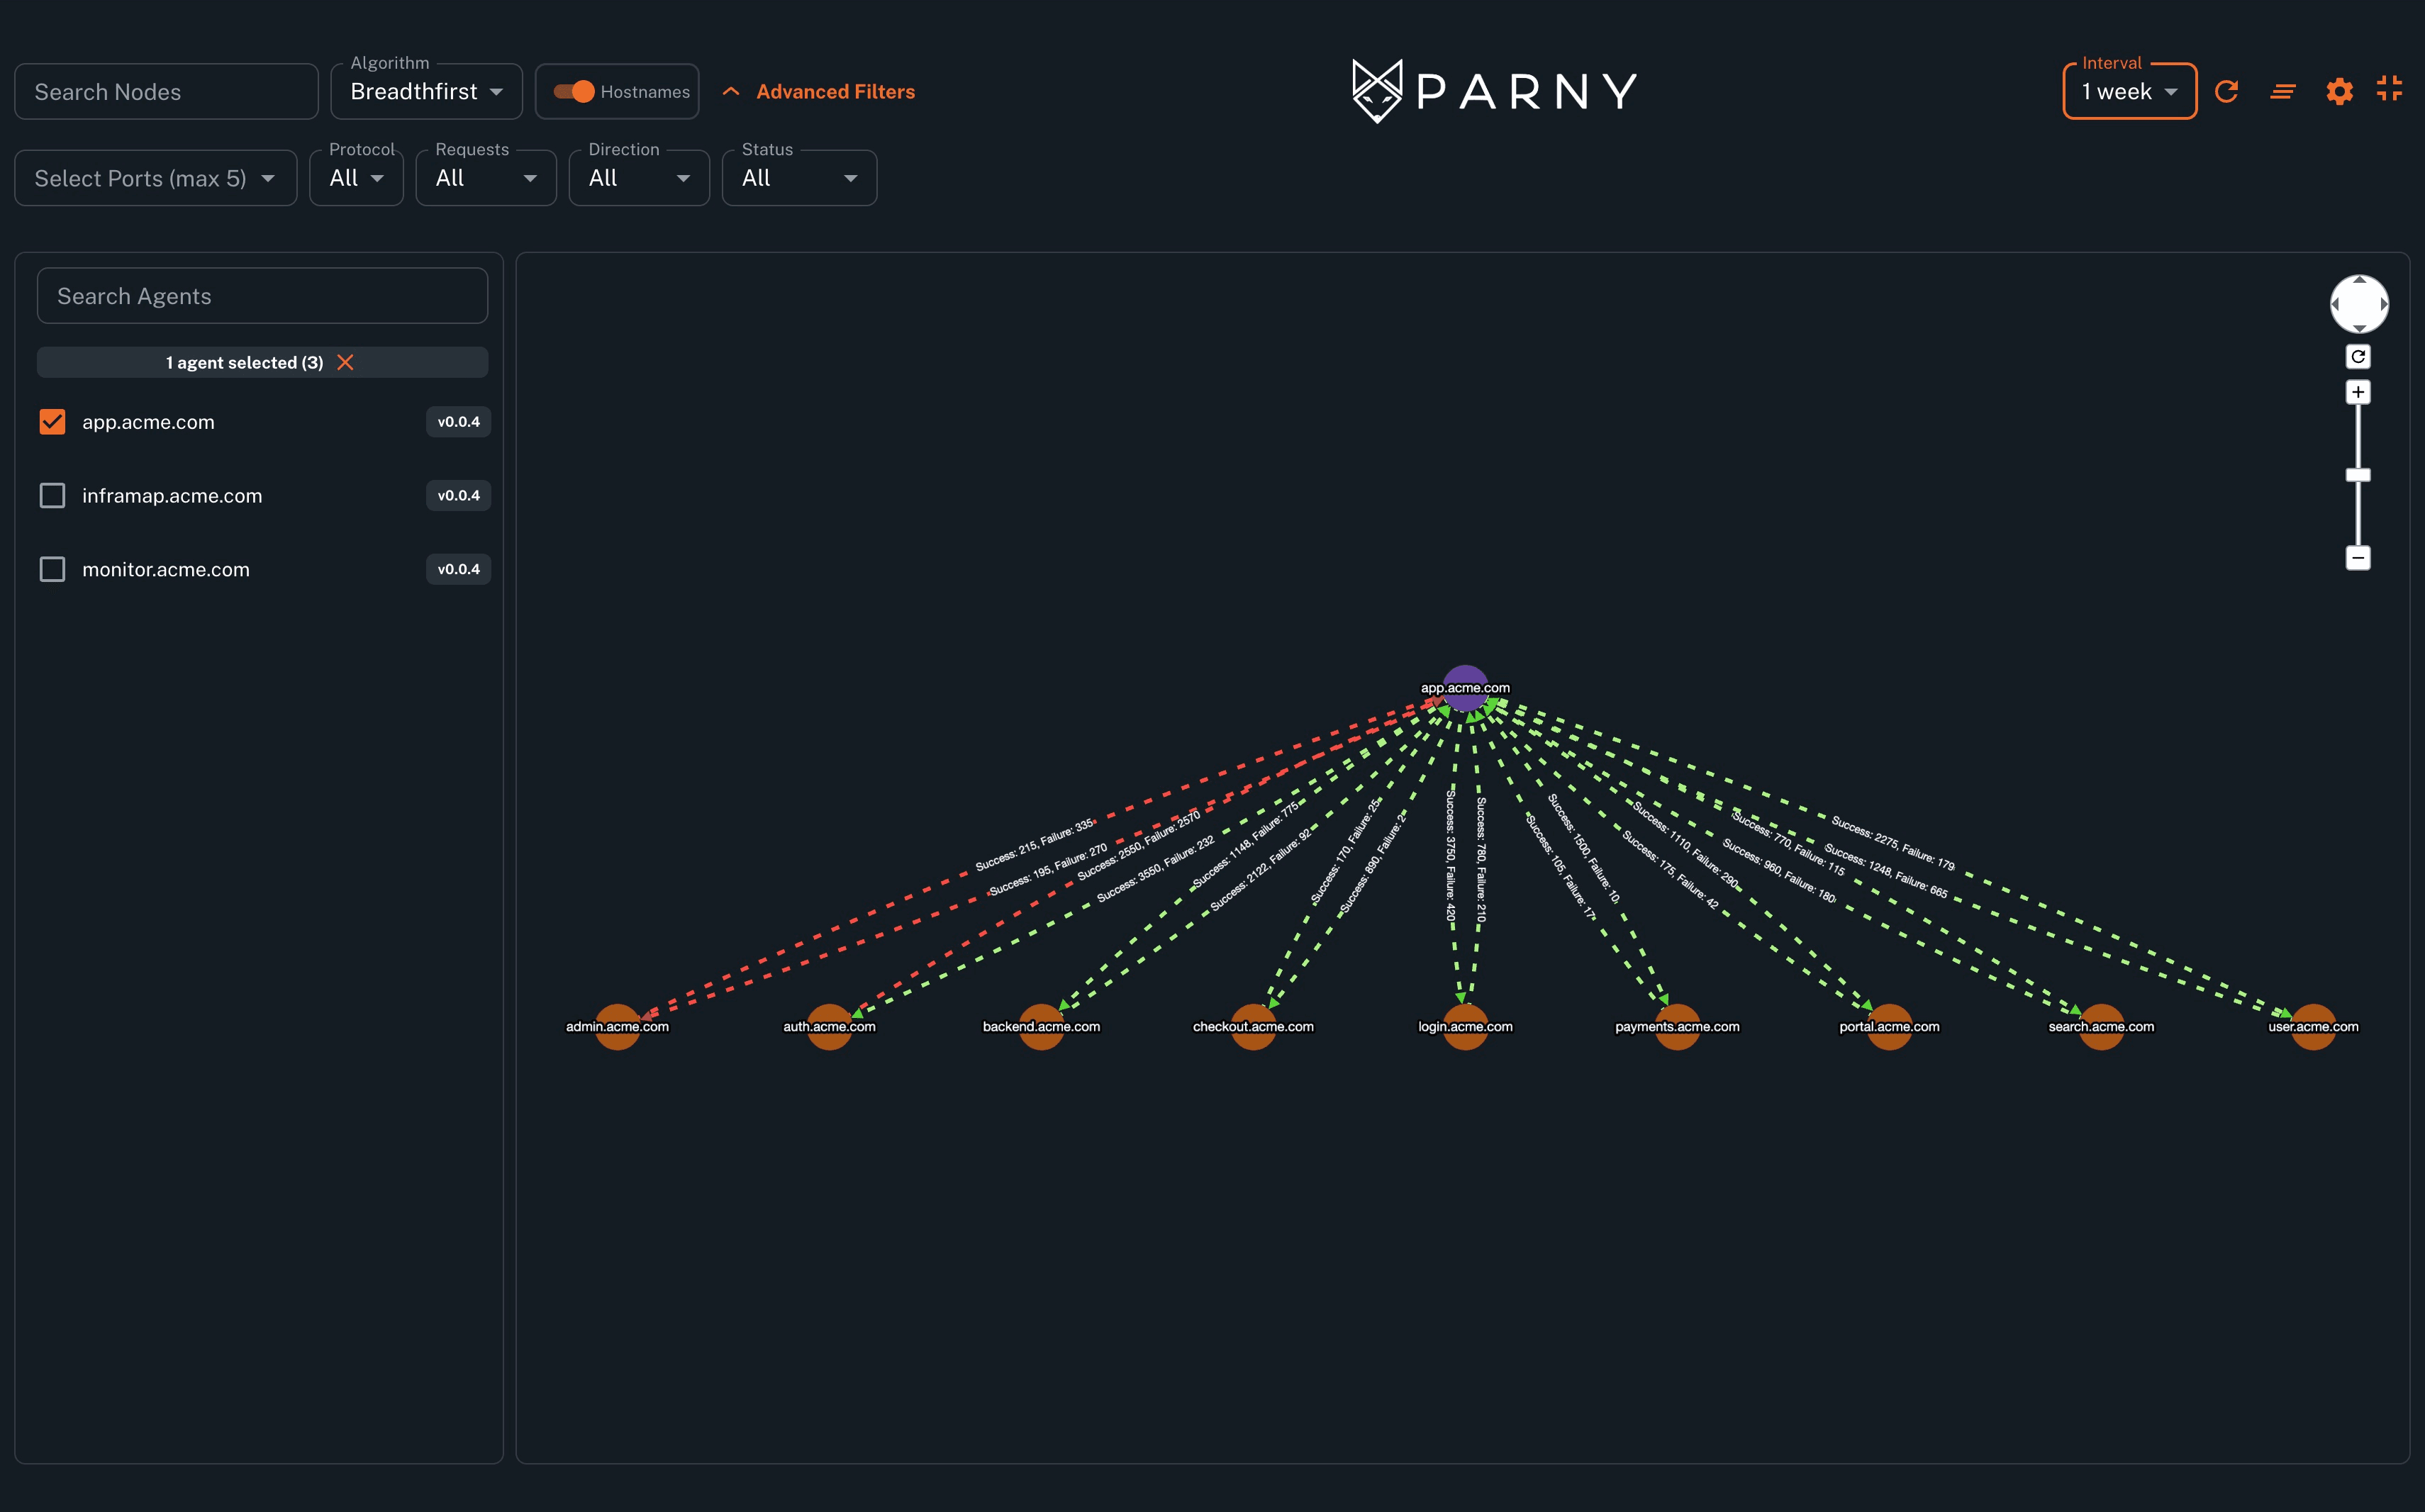
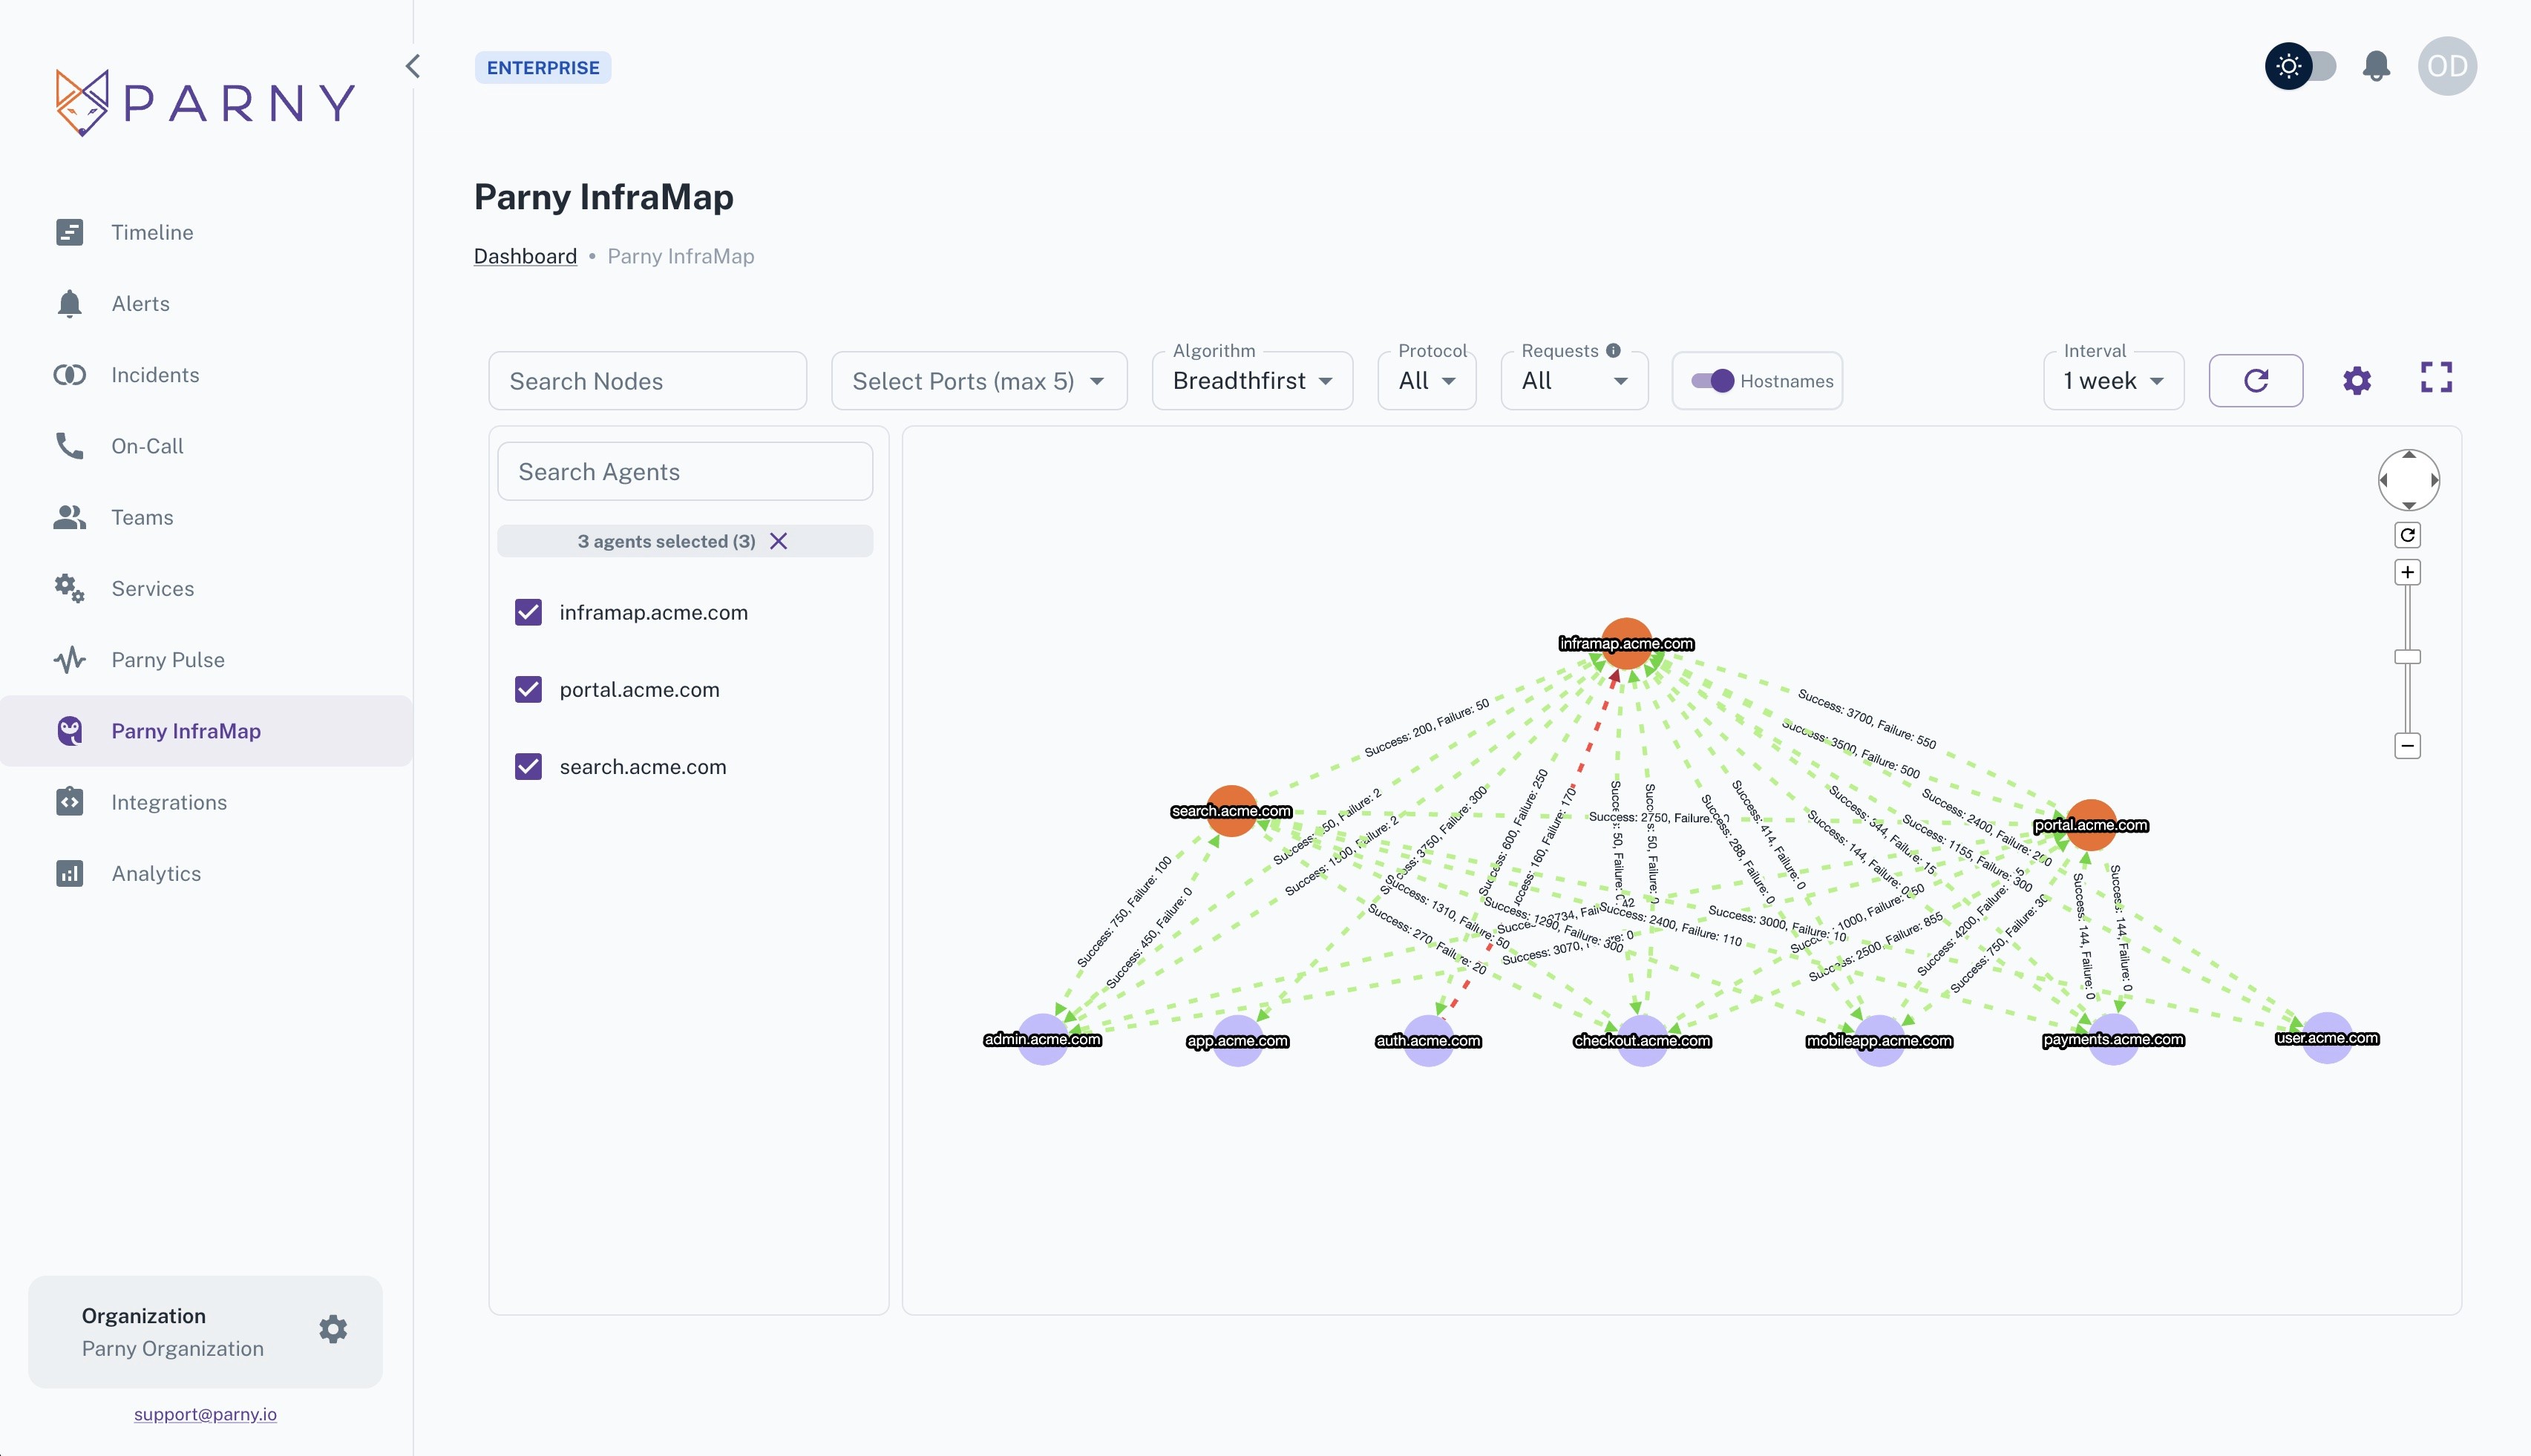
Inside the portal, you get a dynamic graph where each node represents a device or endpoint, and each edge shows the relationship between them.
You can filter by protocol, isolate services, and identify anomalies in real time.
How InfraMap Works: Discovery, Mapping, and Live Updates
InfraMap’s engine works in three key stages:
Discovery: The agent inspects live packets, identifying which hosts and services are communicating.
Mapping: It builds a dependency map, connecting the dots between services, databases, load balancers, and clients.
Live Updates: As the system evolves, InfraMap automatically updates the topology, adding or removing nodes as network behavior changes.
Because this happens in real time, InfraMap isn’t just a “snapshot.” It’s a living, breathing view of your network.
Use Cases & Scenarios
InfraMap is more than a visualization layer, it provides real-time operational intelligence. It reveals how components interact, where failures may propagate, and which services are critical to system stability. Below are key scenarios demonstrating its practical applications.
Bottleneck Detection / Over-Connected Services
In distributed systems, bottlenecks often appear where you least expect them. A single service can become a “traffic magnet” receiving requests from many upstream components. When it slows down, the performance of the entire system can degrade.
InfraMap continuously monitors traffic over TCP, UDP and ICMP, building a real-time connection graph. Nodes with unusually high inbound or outbound connections are immediately visible, helping teams identify over-connected hubs or potential chokepoints.
With this insight, teams can proactively:
Redistribute load between replicas
Add caching layers or throttling mechanisms
Prevent single points of failure before they cause incidents
Incident Triage & Root Cause Hints
During outages, InfraMap acts as an interactive incident map, showing precisely where communication breaks. It tracks packet-level activity to highlight:
Failed TCP handshakes
Repeated retries or timeouts
Hosts or services that have become unreachable
For example, during a slowdown, InfraMap may show that API servers are healthy but a downstream cache is unreachable. The dependency graph highlights the failing connection, providing impact analysis by showing which upstream and downstream services are affected, allowing teams to reduce MTTR by pinpointing the exact source of failure.
InfraMap also visualizes service tiering, showing which services are foundational (tier 0), which depend on them (tier 1, tier 2, etc.), and how issues cascade through the hierarchy. This “service tree” perspective helps teams instantly understand both the root cause and blast radius of any incident.
Cloud Migration / Dependency Planning
Migrating workloads requires a clear understanding of service dependencies to avoid broken communication or missing connections post-migration.
InfraMap provides a complete dependency map:
Identify inter-service communication patterns
Detect cross-region or cross-zone dependencies
Discover legacy systems still in use
Teams can export the dependency map to plan migrations, verify sequences, and ensure no critical services are overlooked. Post-migration, InfraMap enables comparison of pre- and post-move topologies, ensuring all connections are intact.
Configuration Drift / Environment Comparison
Even with infrastructure as code, environments can drift. Ports may be closed, routes misconfigured, or services disconnected.
InfraMap detects these differences by comparing live network maps between environments, such as staging versus production. Teams can see:
Missing or extra routes
Disconnected services
Unexpected open ports
This allows verification of network parity, detection of misconfigurations, and audits of deployments before major releases. InfraMap acts as a real-time diff tool for actual network behavior.
Spotting Unmonitored Services / Blind Spots
Large networks often contain forgotten or unmonitored endpoints, such as legacy daemons or temporary test servers. These components don’t appear in dashboards or alerting systems.
InfraMap automatically discovers them by monitoring all active traffic, identifying:
Hosts or endpoints missed by existing monitoring
Services communicating over unmonitored protocols
Shadow IT components or forgotten processes
This provides teams with improved operational visibility and allows proactive remediation of untracked infrastructure.
Security & Compliance (Unexpected Ports, Protocols)
InfraMap monitors network-level activity to identify unexpected or unauthorized behavior. By analyzing traffic, teams can detect:
New TCP or UDP ports becoming active
ICMP traffic between unauthorized hosts
Unusual protocols appearing in production
Security and compliance teams can overlay InfraMap data with policy rules. Deviations trigger alerts, making it easier to detect policy violations and maintain regulatory compliance.
Dependency Map Creation & Automated Alert Generation
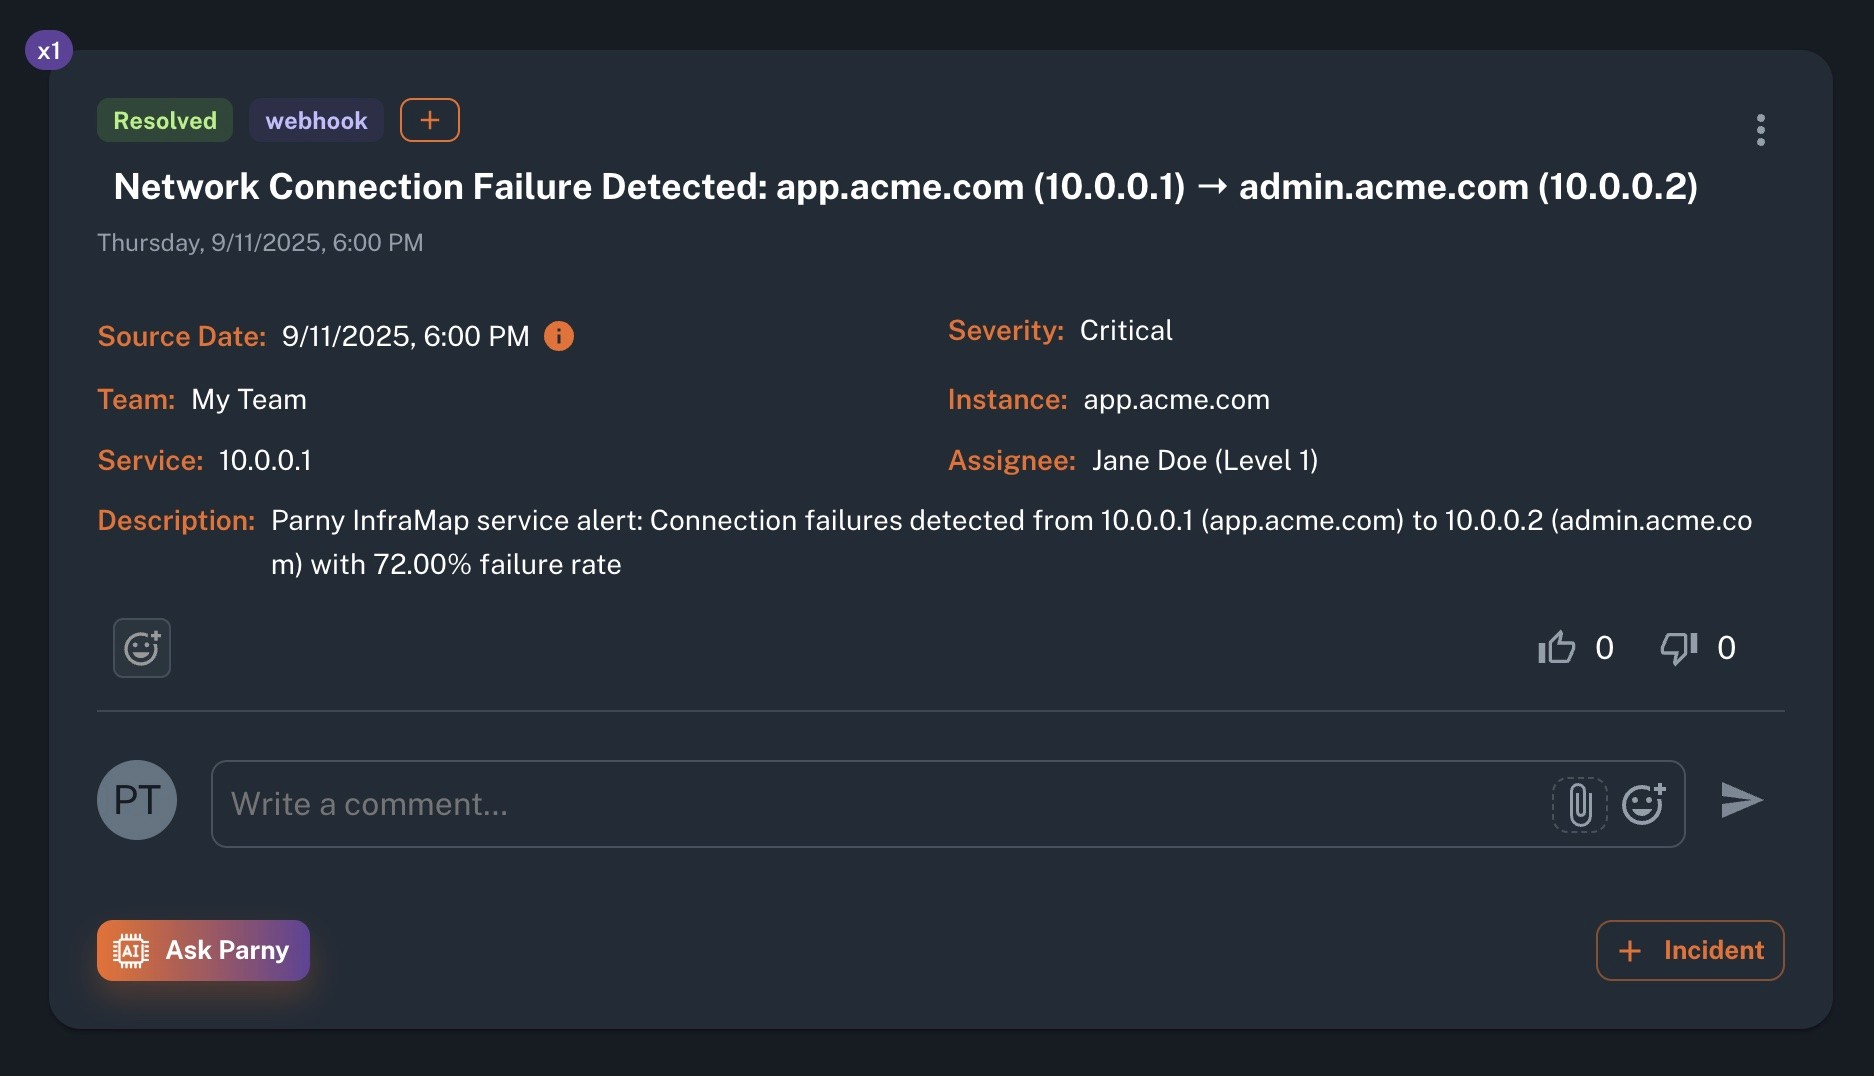
InfraMap can automatically generate a complete dependency map of active services and trigger alerts when changes or anomalies are detected.
These alerts are behavior-driven rather than manually configured:
A previously healthy connection fails
A new, unknown protocol starts communicating
A service dependency disappears suddenly
This functionality transforms InfraMap from a visualization tool into a real-time infrastructure sentinel, continuously monitoring and alerting on changes across your network.
Example Walkthrough: Visualizing a Multi-Service Environment
Imagine a microservices-based application:
a frontend, several APIs, a database, and a cache layer.
After deploying the InfraMap Agent across nodes, the portal starts lighting up. Each service appears as a node, with lines showing live connections.
Suddenly, a user reports slow API responses.
You check InfraMap and see one line glowing red — the API → DB connection shows packet drops.
Moments later, an alert triggers automatically: “Increased TCP failures detected on port 5432 between api-server-3 and db-cluster-1.”
No more guesswork , the map itself tells you what broke and where.
Benefits, Trade-Offs & Challenges
Benefits:
Real-time visualization of every network relationship
Faster RCA during incidents
Automated alerts tied to dependency changes
Increased visibility across hybrid or multi-cloud setups
Trade-Offs:
Requires packet capture permissions (network-level access)
Generates detailed traffic data, may need filtering to reduce noise
Agent management at scale (but mitigated by centralized control)
Best Practices & Tips
Deploy strategically: Start with critical nodes and expand gradually.
Use filters: Limit visualization to relevant protocols (TCP/UDP/ICMP) for clarity.
Integrate: Connect InfraMap alerts to existing monitoring or SIEM pipelines.
Review dependency maps regularly: They evolve as your systems do.
Summary:
When everything depends on everything else, visibility isn’t optional. It’s vital.
Parny InfraMap helps teams make sense of complexity by mapping what’s truly happening in their systems. Automatically, in real time.
Whether you’re hunting bottlenecks, preventing incidents, or planning a migration, InfraMap turns invisible dependencies into actionable insight.
Explore it yourself: Parny Inframap


