Advanced features
What is Domain Tree?
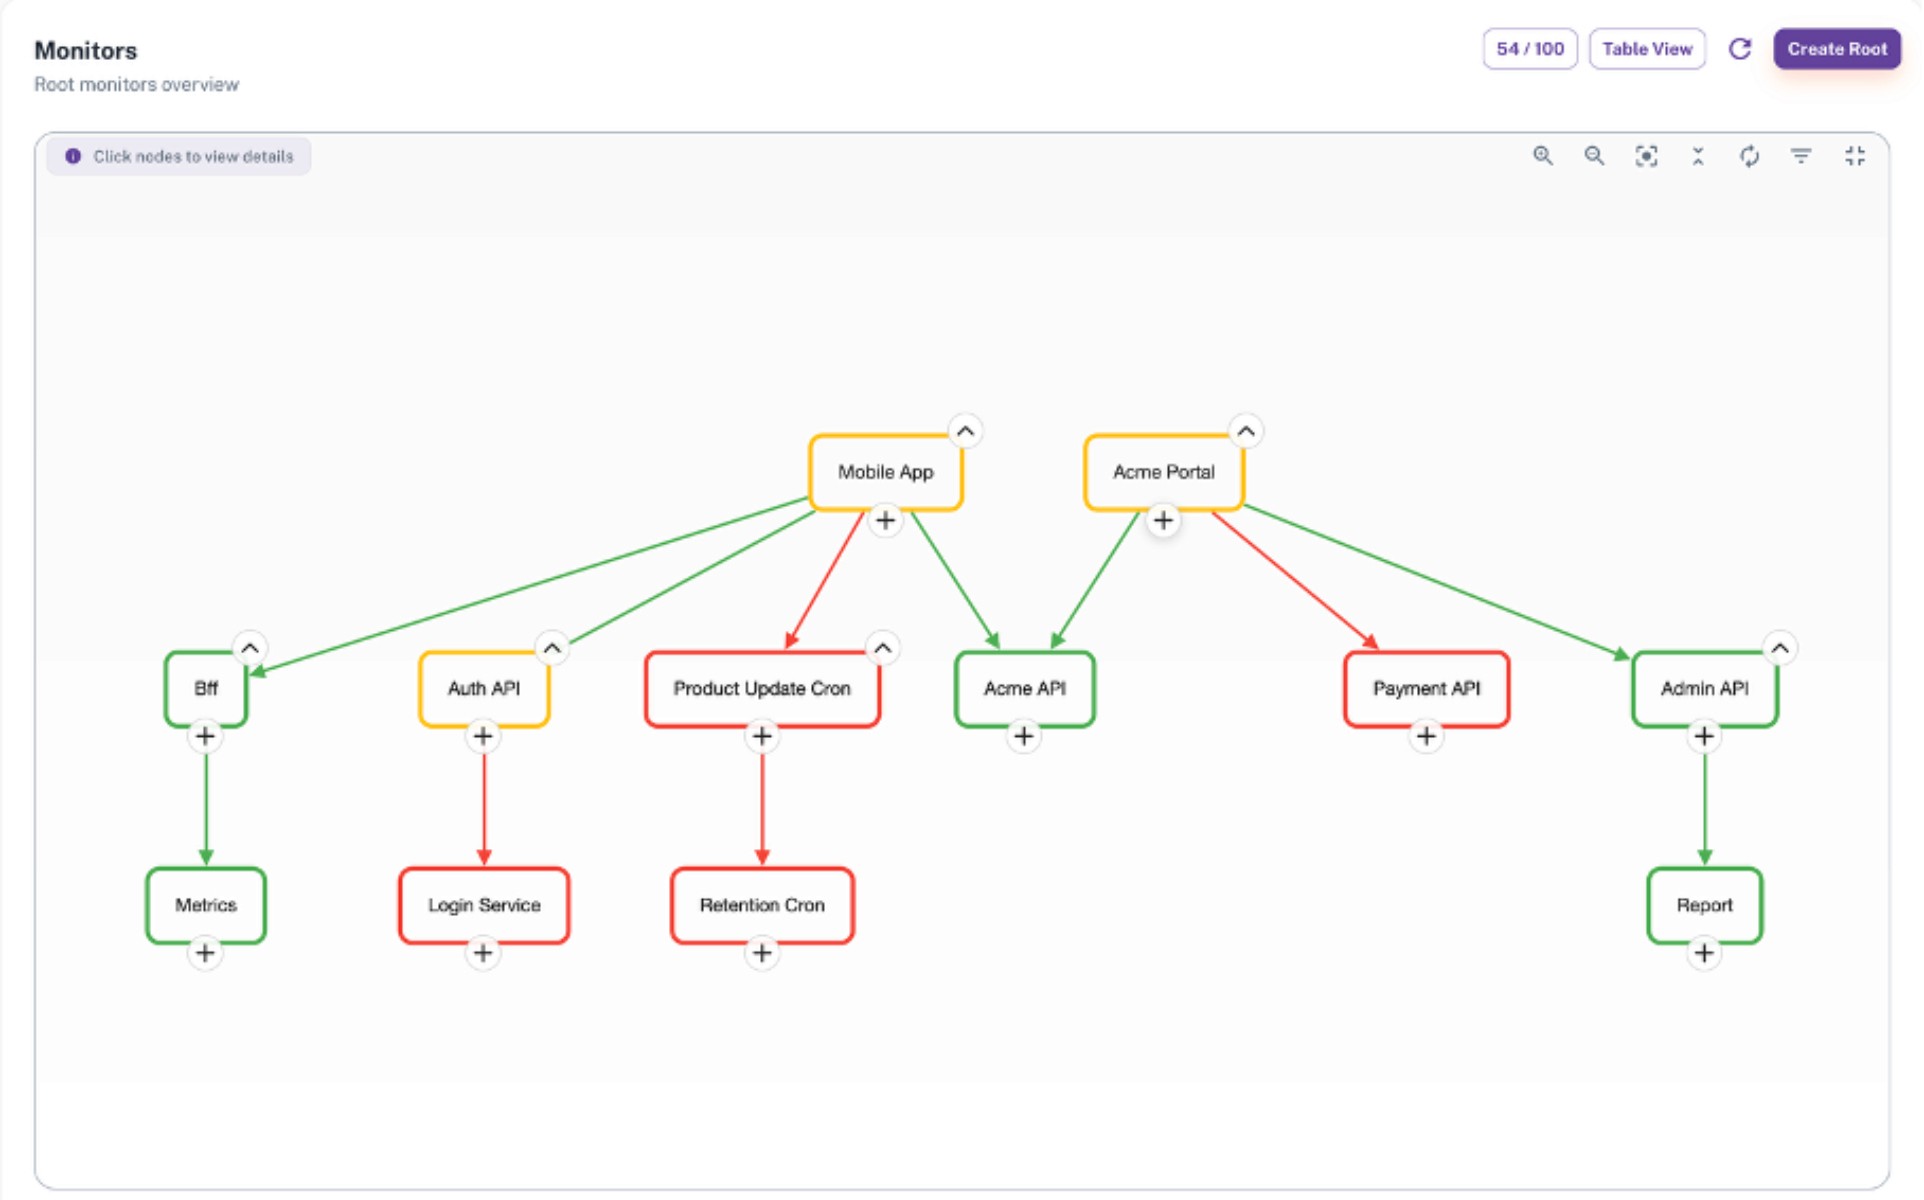
Domain Tree is a real-time visibility layer that maps all domain, services, APIs and endpoints end-to-end, displaying dependency flows, impact chains and AI powered anomaly detection signals on an single unified map.
Key Components
Domain: The logical grouping that represents a service or sytem boundary.
Node: A monitored component within the Domain Tree.
Root Node: The top-level node that represents the overall status of the domain.
Leaf Node: A dependent node whose status can propogate upward.
Dependency: The relationship indicating which nodes rely on others.
Status: The health state assigned to a node. Up, down.
Status Propagation: The mechanism that transfers the impact of the status of a leaf node upward through the hierarchy.
Domain Tree Operational Model
Dependency and Status Propagation
Each node has a color-coded real-time health indicator:
🟢 Green: The node is up, and all of its dependent nodes are also up.
🟡 Yellow: The node itself is up, but at least one dependent node is down.
🔴 Red: The node itself is down or not responding.
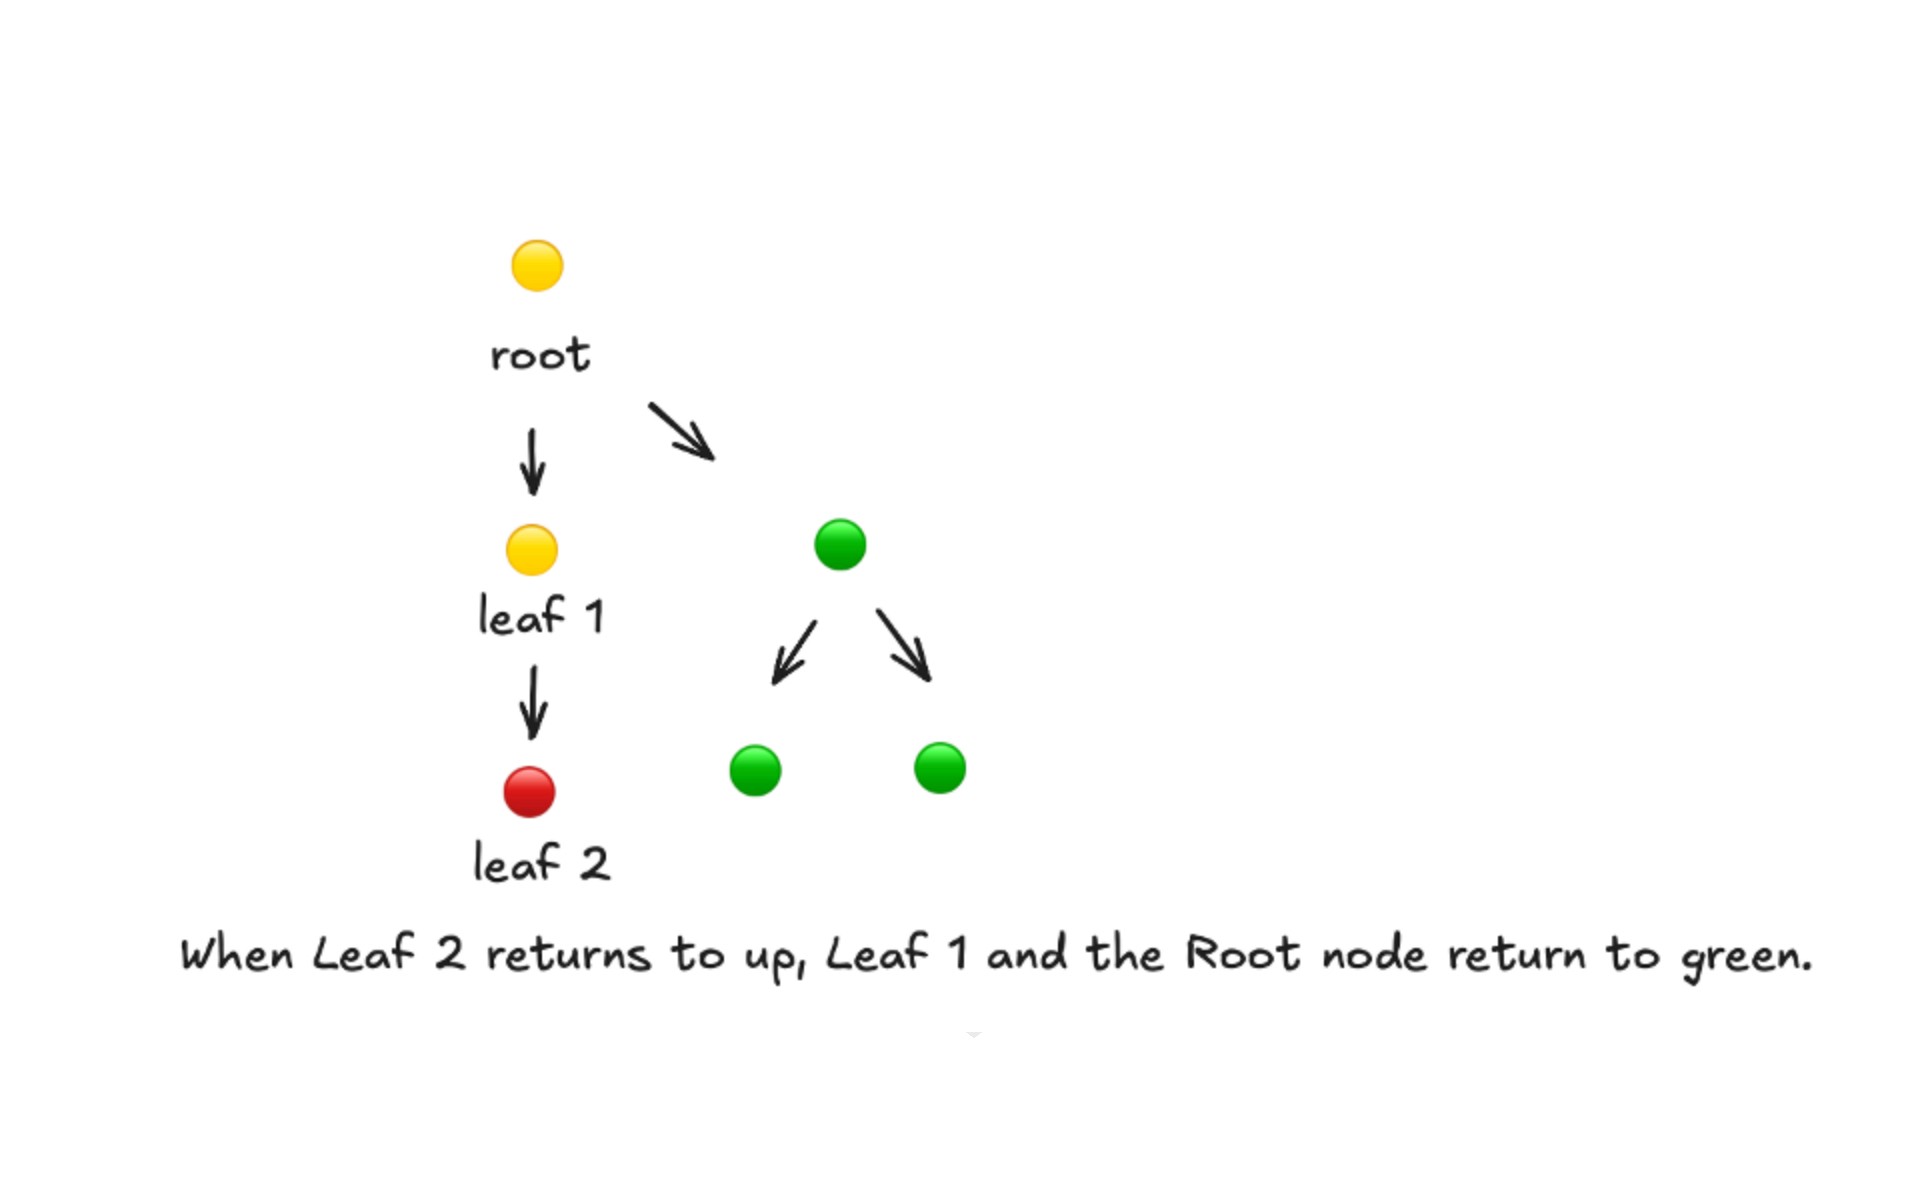
Domain Tree uses a status propagation model to represent how a failure in one node affects the nodes that depend on it. The structure operates with two roles: Root and Leaf.
A Leaf node relies on another component, while a Root node is a component that others depend on.
When a Leaf node goes down, the impact propagates to its Root, marking it as affected. This allows teams to immediately identify both the origin of the issue and the components influenced by it.
The propagation logic is deterministic:
• If a Leaf node goes down, its Root is marked as affected
• If the Root is also not responding, it becomes down
• When the Leaf returns to up, the propagation chain clears automatically and all related nodes return to normal
This model makes the impact propagation path visible without log analysis or dashboard switching. Teams can quickly determine where the issue originated and how far it has spread, enabling faster and more confident operational decisions.
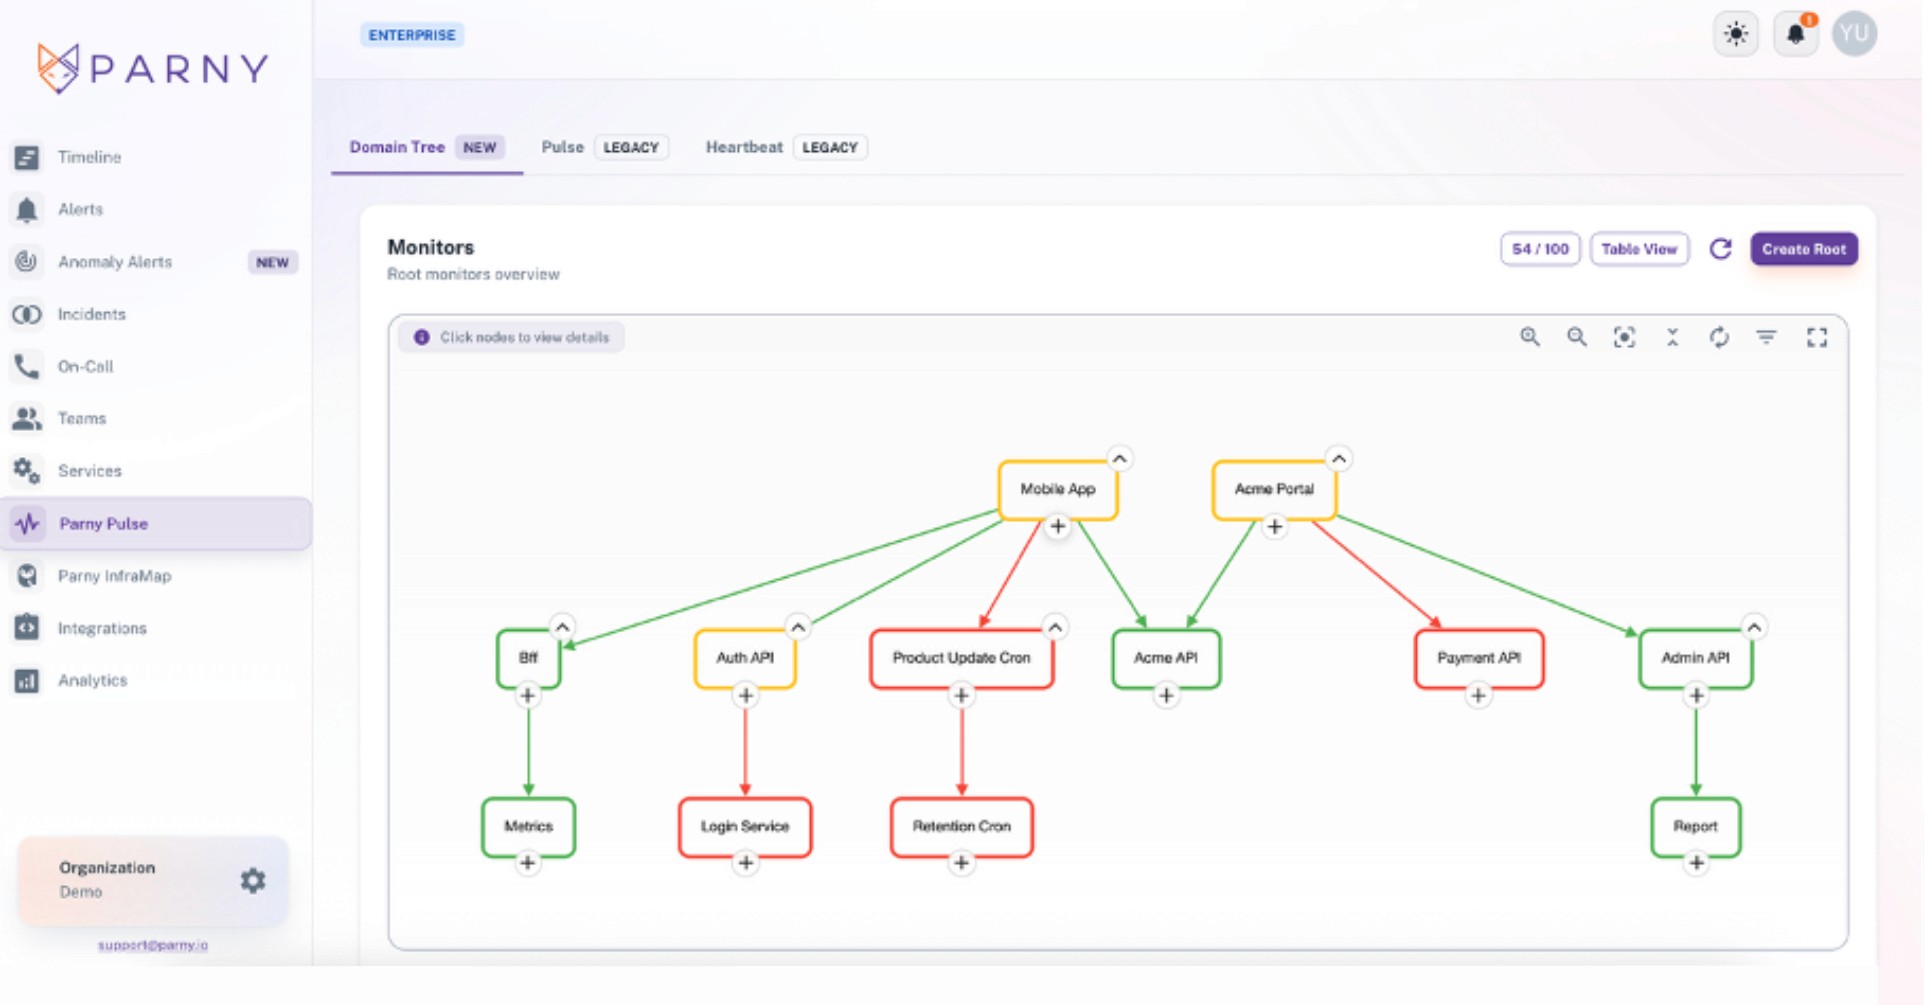
Domain Tree Configuration Process
Create Root
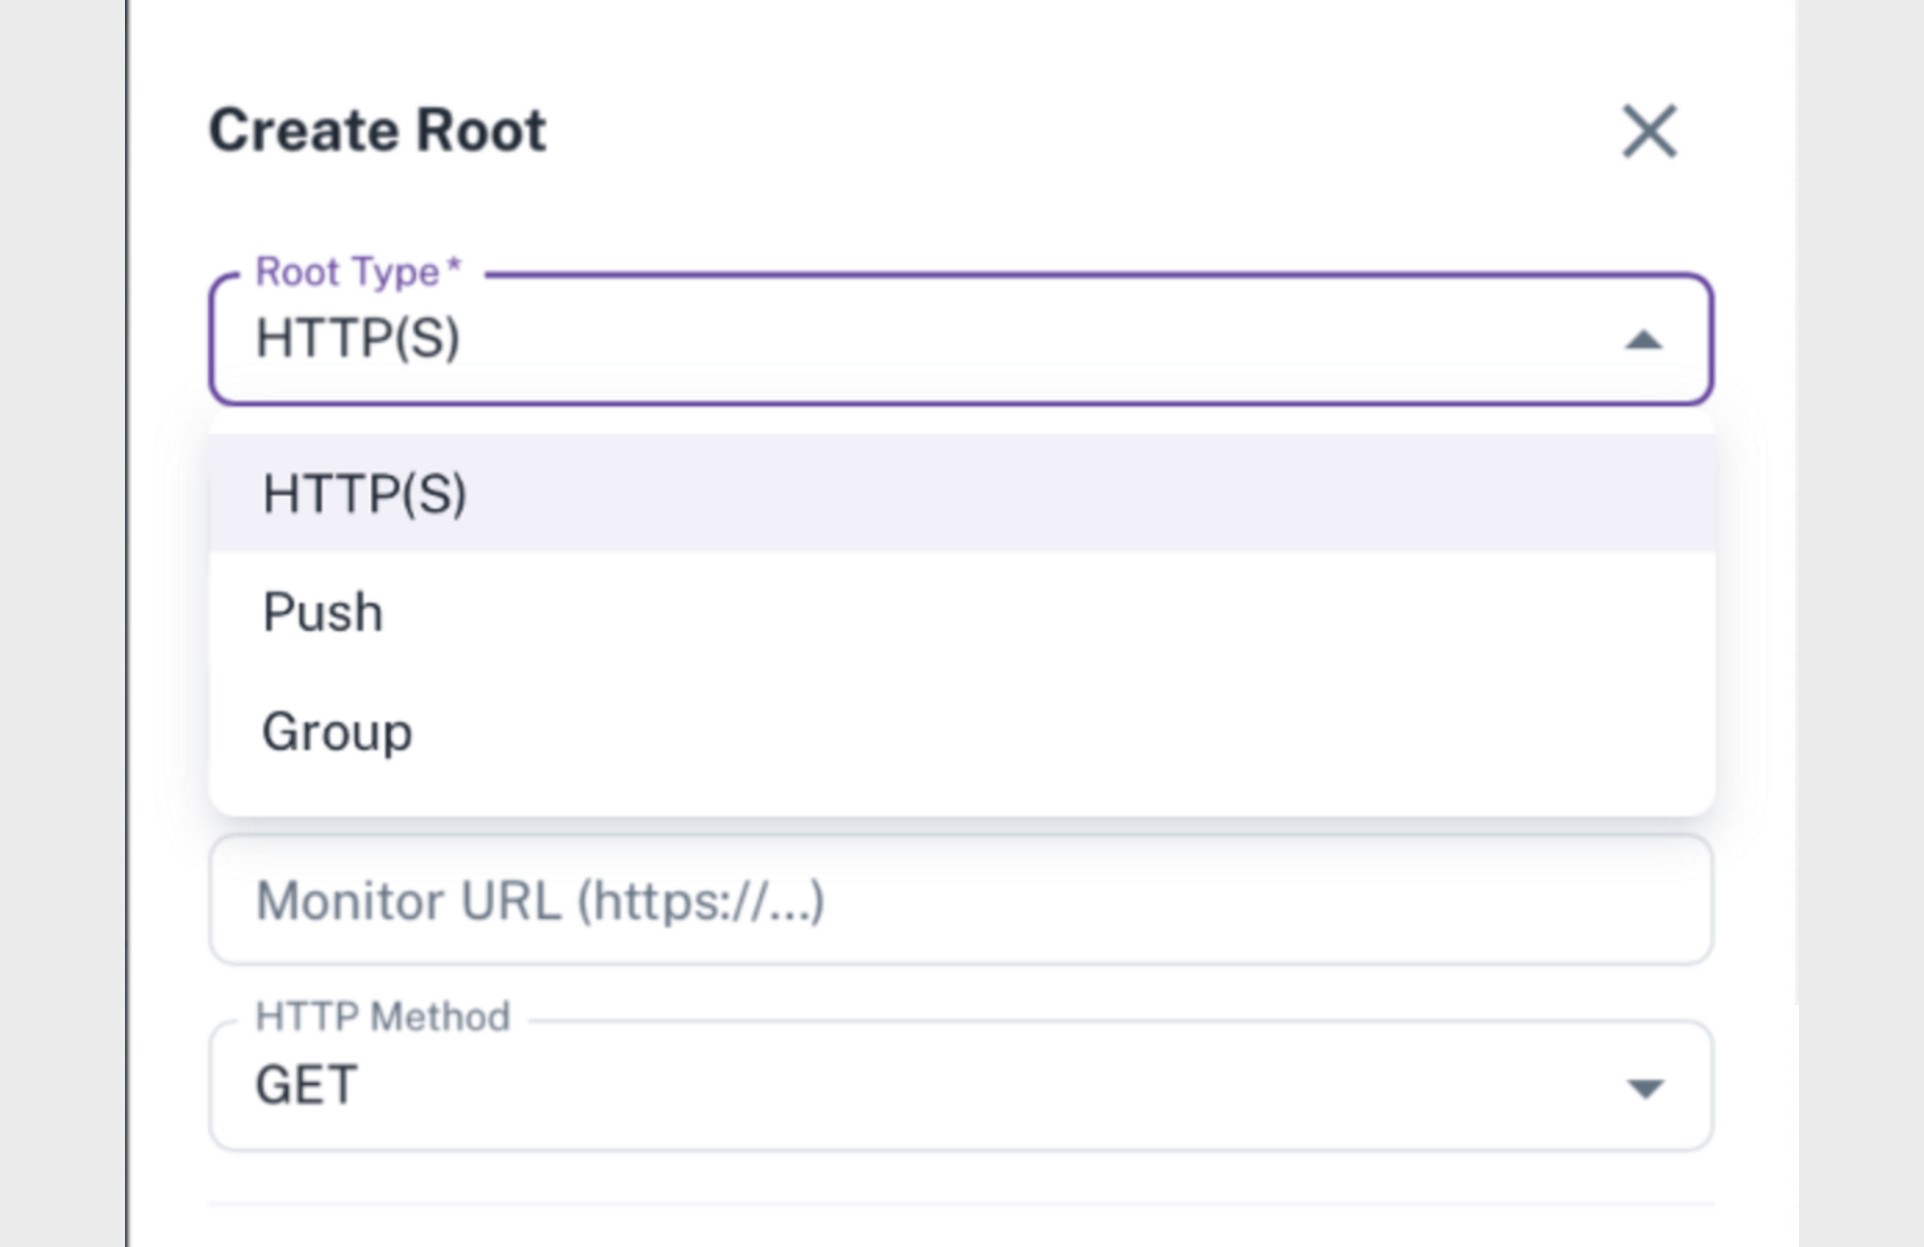
To start using Domain Tree, the first step is to create a Root.
This is done by clicking the Create Root button in the Domain Tree interface and selecting a Root type.
Parny currently supports three Root types:
HTTP(S)
Push
Group
Choosing the correct type ensures accurate health reporting and helps prevent unnecessary noise in your environment.
Each method serves a different operational need and should be selected based on how your service exposes its status.
HTTP(S) Monitoring
HTTP(S) monitoring is a method in which Parny periodically sends HTTP requests to a target address (domain, IP, or endpoint) to evaluate its availability and responsiveness. Based on the response, Parny determines whether the node is up or down, and calculates uptime automatically.
How it works:
Parny sends an HTTP request to the URL you define at the configured interval.
The response status code is compared against the Accepted Status Codes list.
If the response matches the accepted codes, the node is marked as up.
If it does not, Parny retries the request based on your Max Retries configuration.Each retry is separated by the defined Retry Interval.
If all retry attempts fail, the node is marked as down and an alert is triggered.All request results are recorded and included in uptime calculations.
Redirects can be followed and optionally treated as accepted responses.
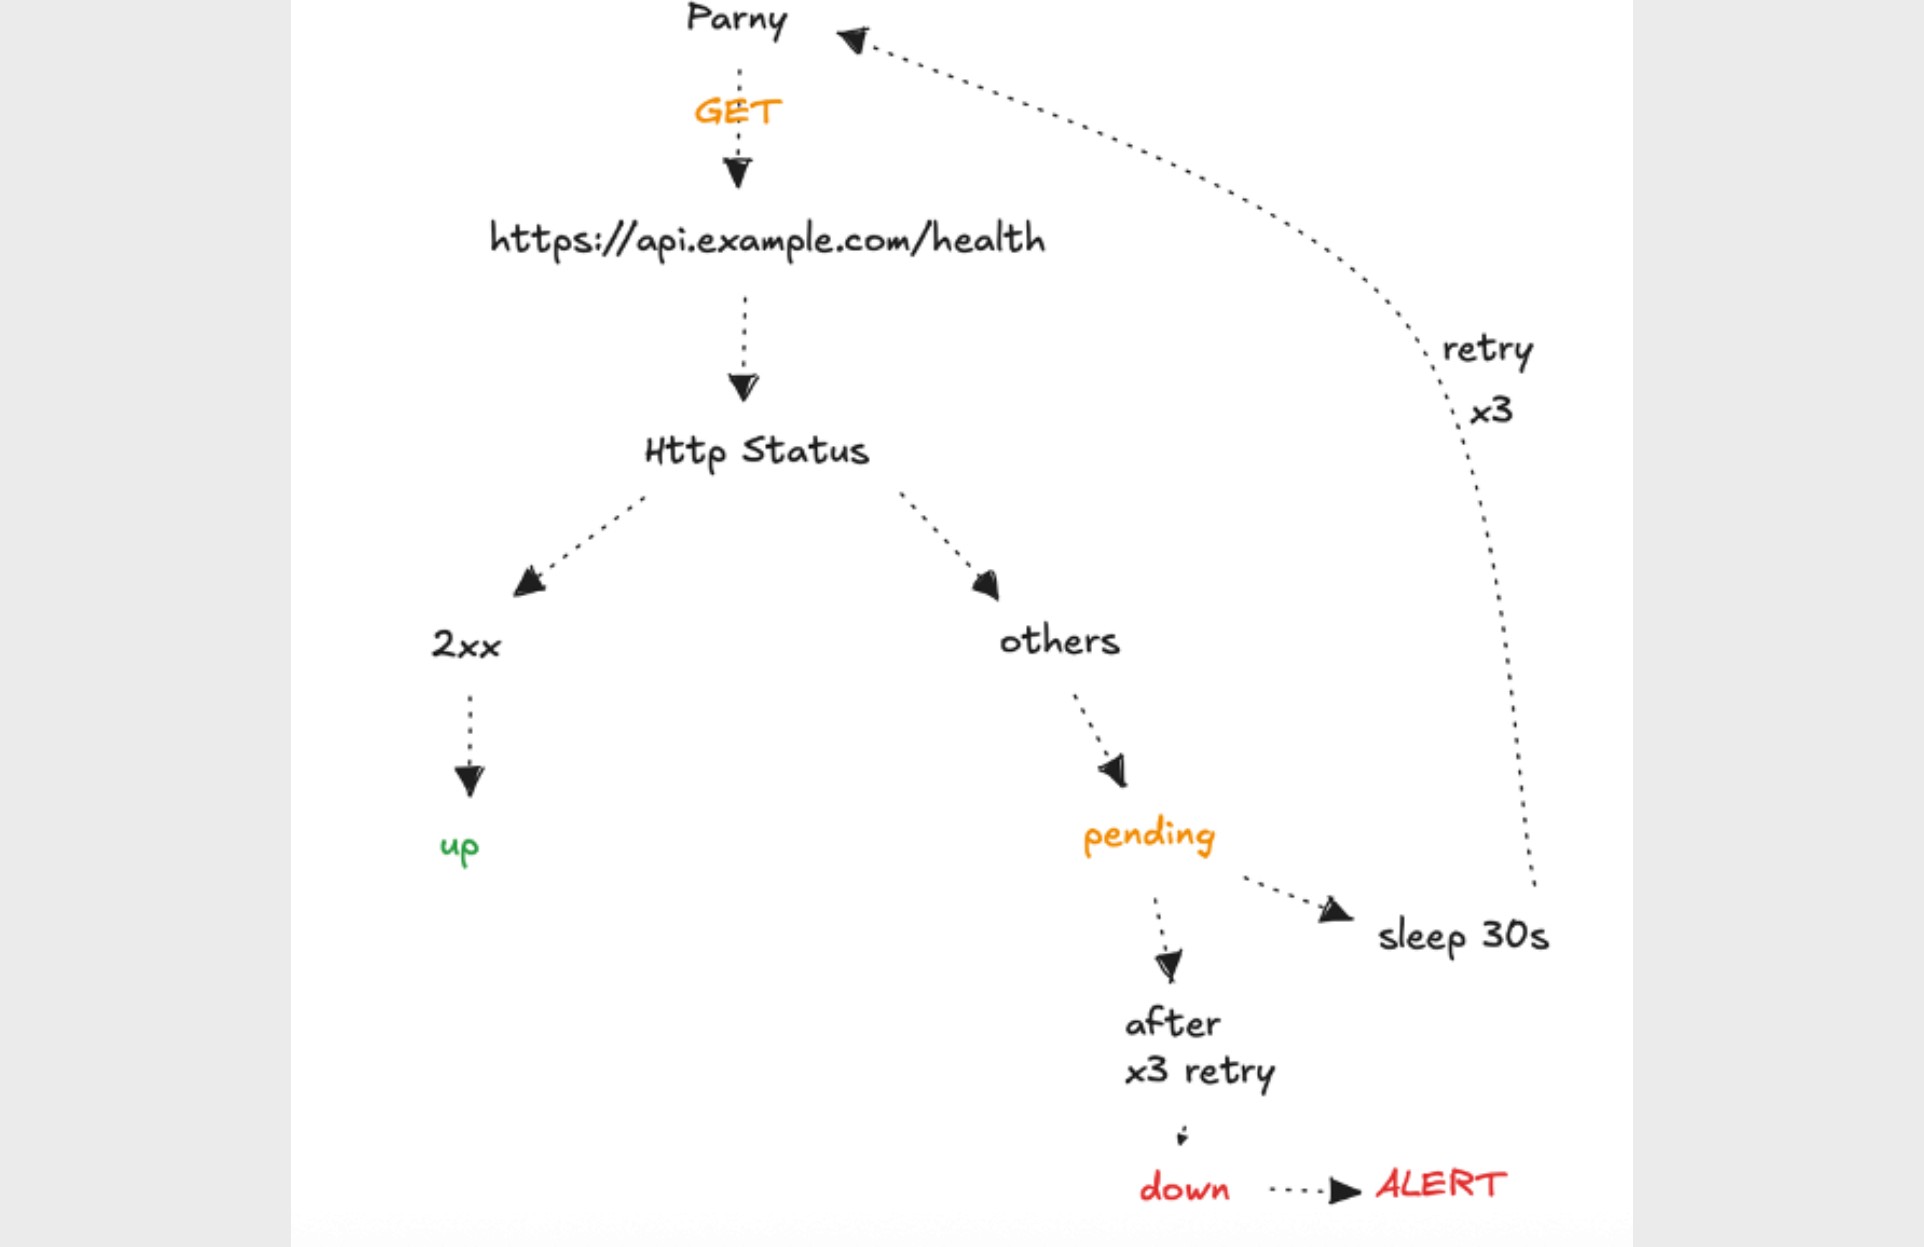
Example scenario:
A web API is monitored every 30 seconds.
Parny sends a
GET _https://api.example.com/health_request.If the response status code is within the configured accepted range (e.g., 2xx), the node is marked as Up.
Any other response triggers the retry mechanism.
If all retry attempts fail (e.g., 3 retries), the node is marked as Down and an alert is generated.
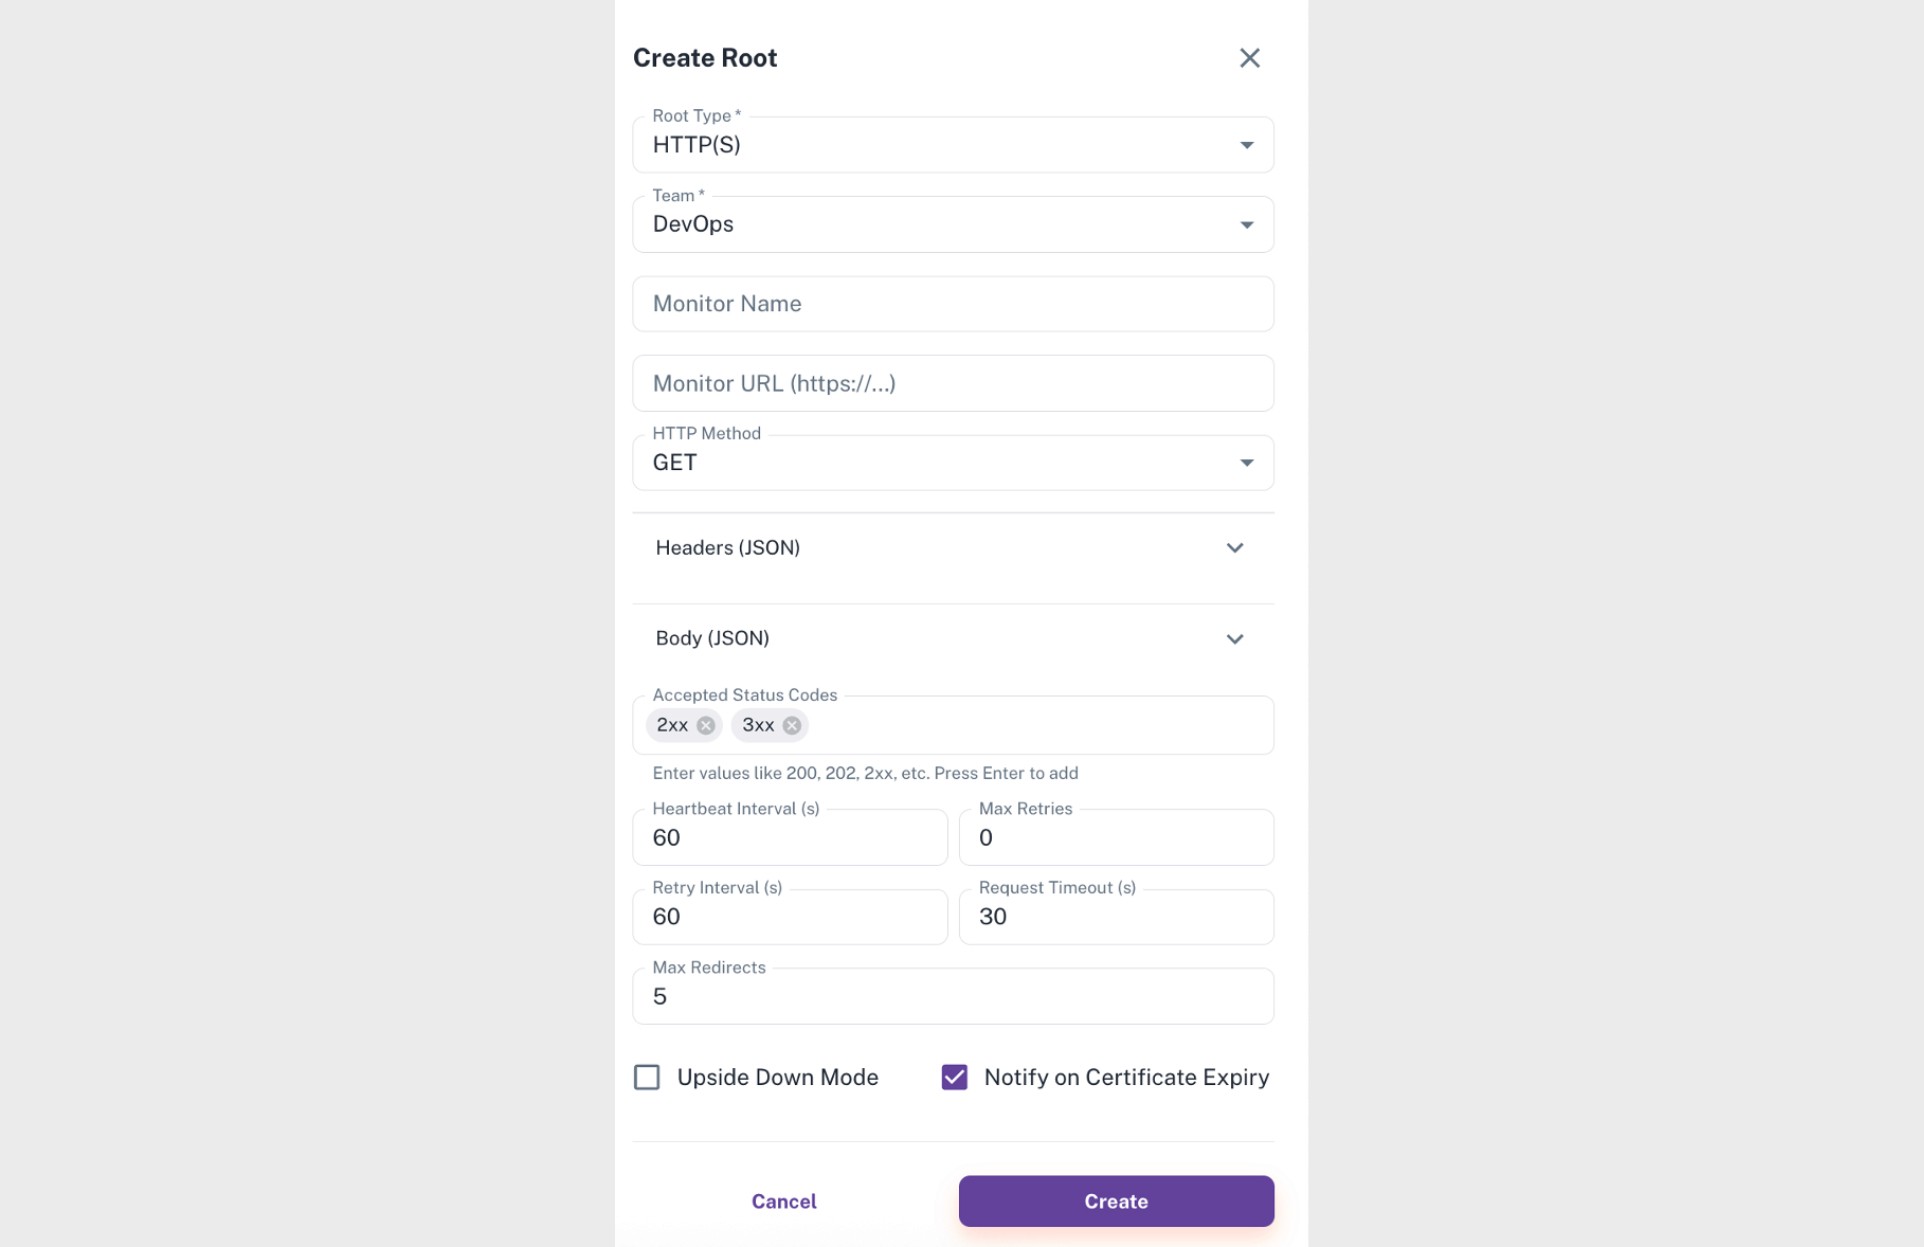
Field | Description |
|---|---|
Root Type | Specifies the component type. For HTTP(S), Parny sends periodic requests and determines the up/down state based on the response. |
Team | The team responsible for the node. Alerts are delivered to this team. |
Monitor Name | The display name of the node in the Parny interface. |
Monitor URL | The endpoint being monitored. |
HTTP Method | Supported methods include GET, POST, PUT, PATCH, DELETE, HEAD, OPTIONS. |
Headers (JSON) | Optional request headers. |
Body (JSON) | Payload for POST/PUT requests. |
Accepted Status Codes | The set of HTTP codes considered as a successful response. |
Heartbeat Interval (s) | Frequency of checks in seconds. |
Max Retries | Number of retry attempts after a failed request. |
Retry Interval (s) | Delay between retries. |
Request Timeout (s) | Maximum time to wait for a response. |
Max Redirects | Number of allowed redirect hops. |
Upside Down Mode | Reverses success and failure logic for special validation scenarios. |
Notify on Certificate Expiry | Triggers a warning when an SSL certificate is about to expire |
HTTP(S) monitoring is most effective for components that:
• expose a health or status endpoint
• require continuous availability verification
• interact over public or internal networks
Typical examples include:
• Web applications
• Public or internal APIs
• Services exposed through HTTP endpoints
To ensure accurate health evaluation:
• Define Accepted Status Codes based on expected service behavior
• Set Max Retries according to network reliability and latency
• Keep certificate validation enabled to detect SSL/TLS issues early
Push Monitoring
Push monitoring is a method where the monitored node reports its own status to Parny at defined intervals. In this model, Parny does not send any requests to the node. Instead, the node periodically sends "up" signals, and optionally "down" signals, to indicate its current state.
This approach is suitable for environments where inbound traffic is restricted, or the service cannot be reached externally but can safely send outbound requests.
How it works:
The monitored node sends periodic "up" signals to a unique URL provided by Parny.
If no signal is received within the expected timeframe, the node enters a pending state.
When the timeout period fully passes without receiving a signal, the node is marked as down and an alert is triggered.
If configured, Parny retries the verification based on the defined Retry Interval.
A node can also send an explicit "down" signal if it performs its own internal health checks.
This mechanism is especially useful for cronjobs, background workers, daemons and internal microservices that cannot be polled from the outside.
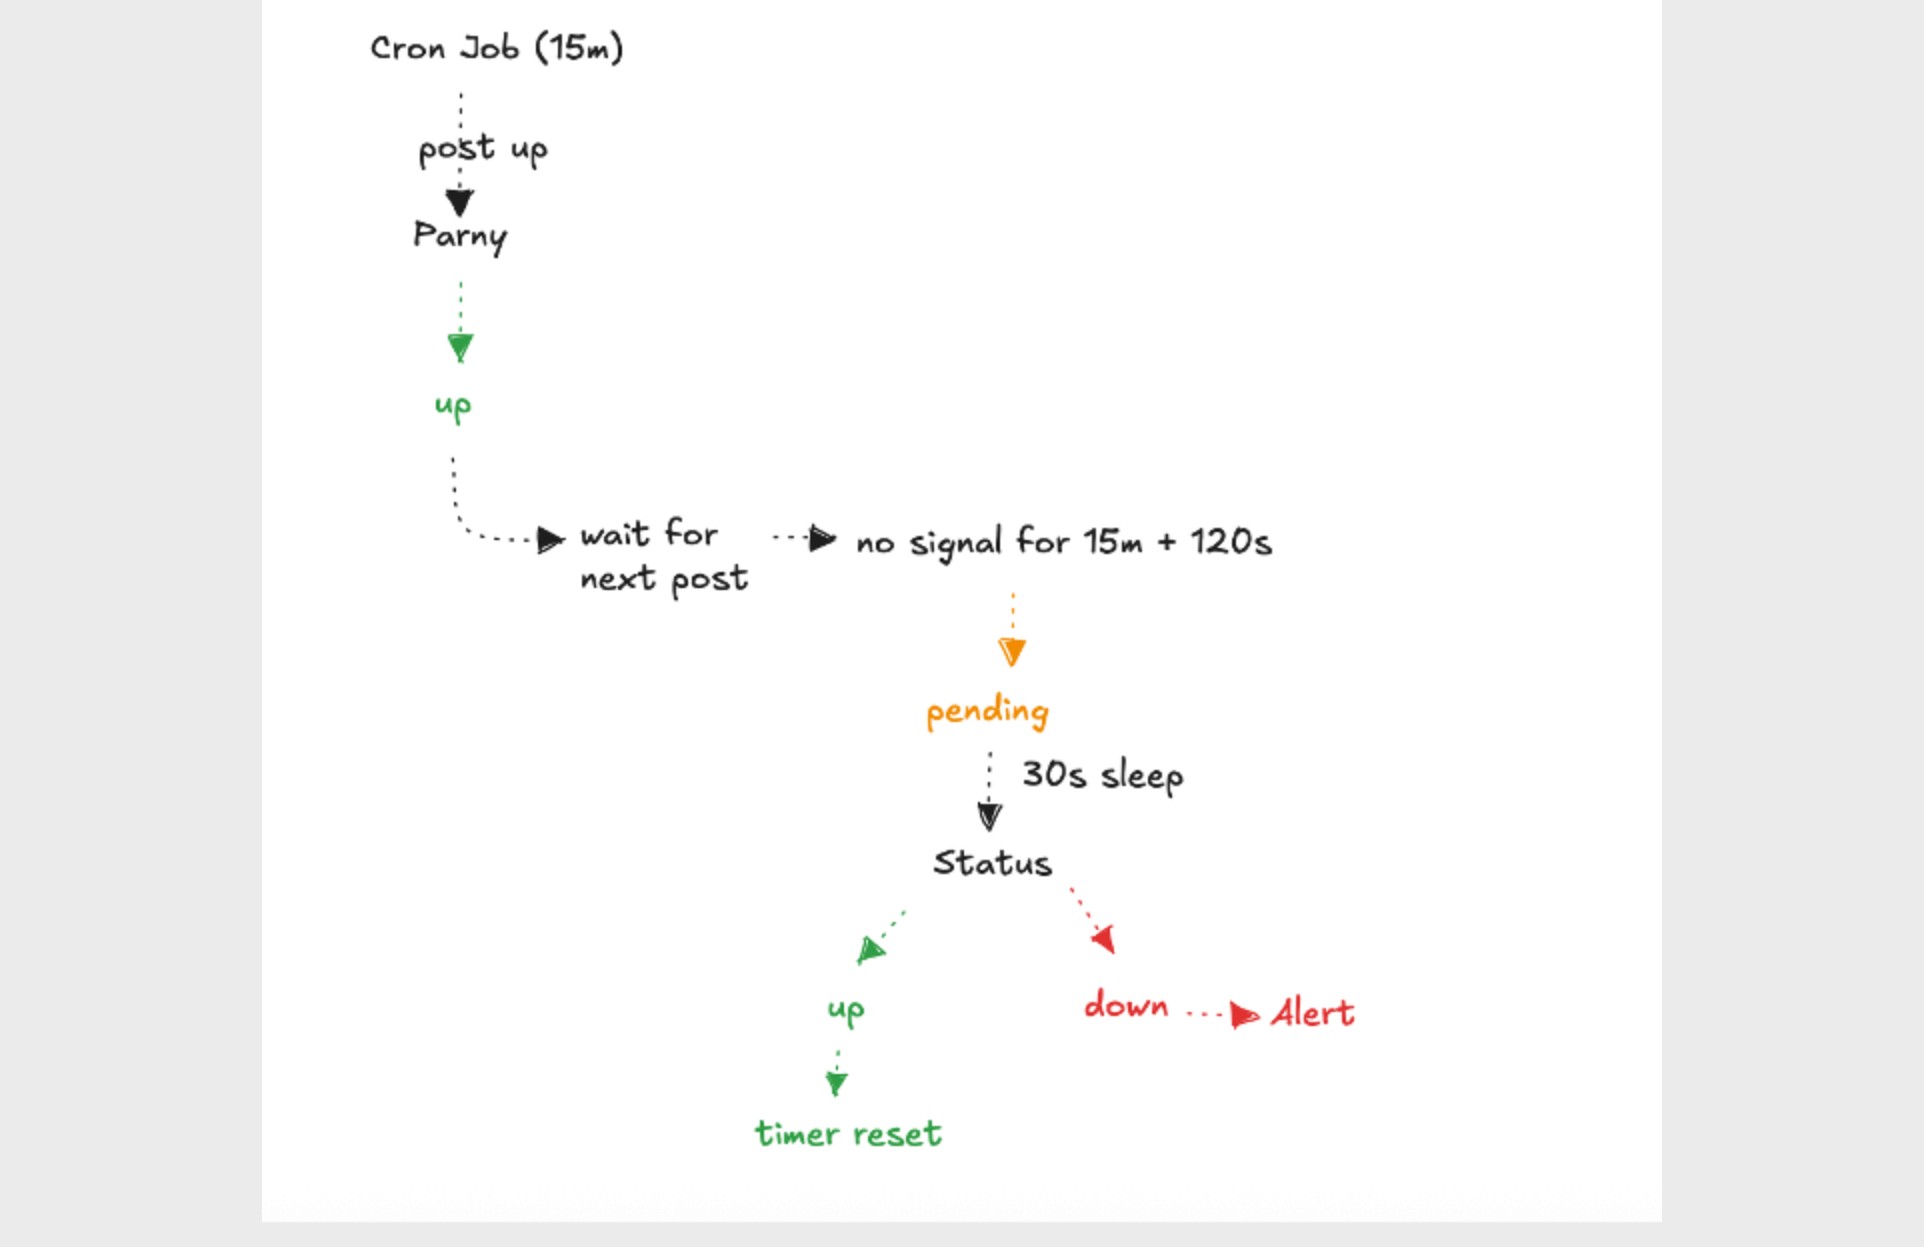
Example scenario:
There is a cronjob running inside a service every 15 minutes.
Each time it runs, the cronjob sends a POST /push/up request.
If we configure the interval as 120 seconds and no up signal is received within 15 minutes plus 120 seconds:
The system first enters the Pending state.
If a Retry Interval is defined, Parny performs another check.
If no up signal is received after this point, the node is marked down and an alert is triggered.
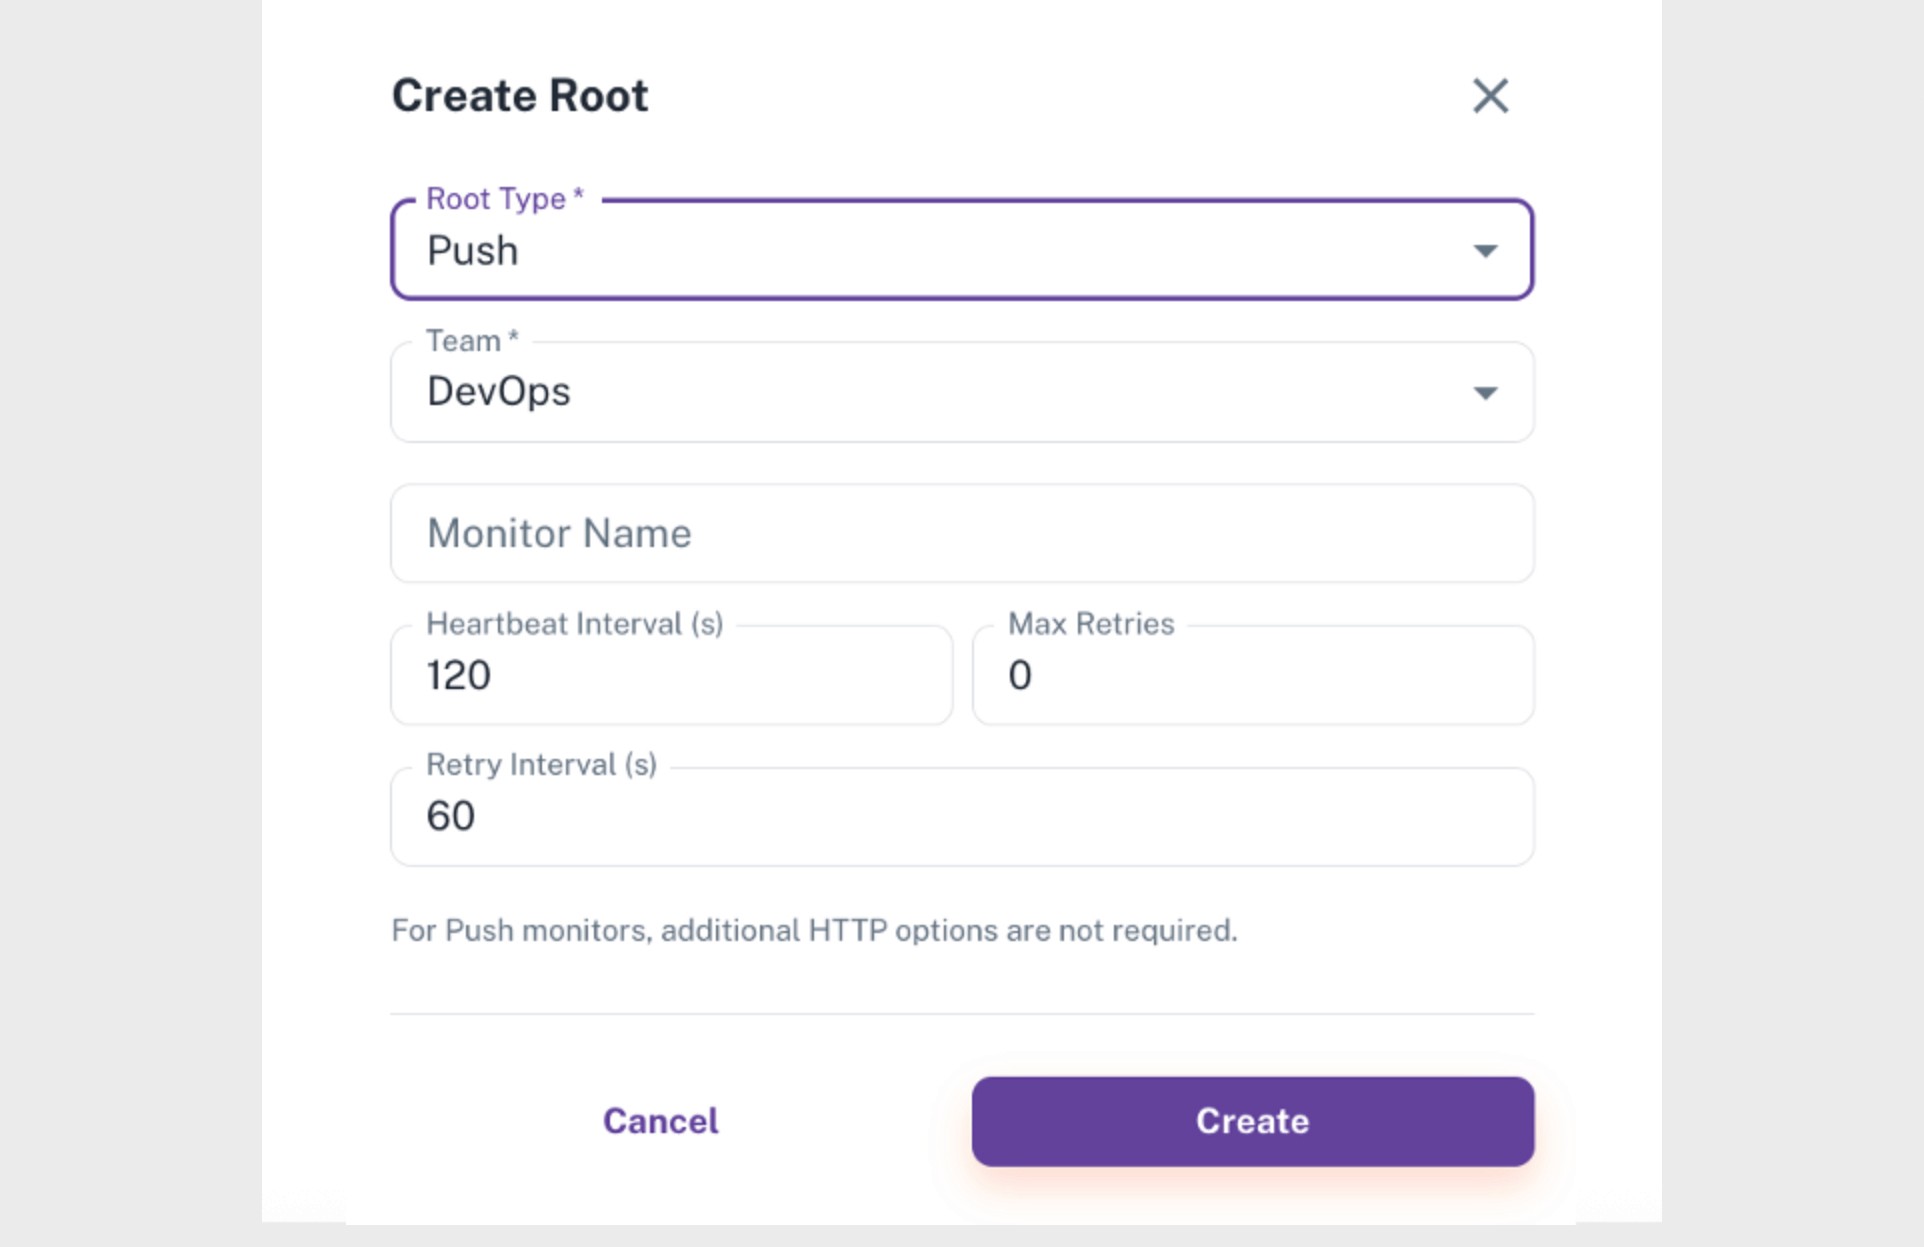
Field | Description |
|---|---|
Root Type | When Push is selected, the node reports its own status to Parny. No external requests are made. |
Team | The team responsible for the node. Alerts are delivered to this team. |
Monitor Name | The display name of the node in Parny. |
Heartbeat Interval (s) | Expected frequency of incoming signals. |
Max Retries | Number of verification attempts after a missing signal. |
Retry Interval (s) | Delay between consecutive verification attempts. |
Push monitoring is ideal for:
• Services running behind NAT that cannot be accessed externally
• Nodes that cannot accept inbound connections due to firewall restrictions
• Cronjobs, workers and daemon-style applications running internally
• Scenarios where microservices need to send their own health signals to Parny
For an effective Push configuration:
The cron or worker interval should be aligned with the Push Timeout value.
If up signals arrive consistently, the timeout should not be set too low to avoid false down states.
For nodes that send explicit down signals, internal self-diagnosis must be correctly implemented and validated.
Group Monitoring
Group monitoring is a logical aggregation method that does not perform any checks on its own. It reflects the combined status and uptime of the HTTP(S) and Push nodes assigned under it. The purpose of a Group node is to provide a higher-level view of related components and present their overall health in a single location.
How it works:
A Group node collects the up/down states and uptime values of all nodes placed under it.
Its own uptime is calculated as the average uptime of these nodes.
The Group node does not send HTTP requests or receive push signals; it only consolidates the results.
This allows teams to understand the overall state of a functional area or workflow without checking each node individually.
Example scenario:
For example, consider the following monitored nodes:
Portal UI (HTTP(S))
Authentication API (HTTP(S))
Backend Service (Push)
Instead of evaluating them individually, they can be placed under a Group node such as “User Journey” or “Auth Stack”.
If their uptimes are:
Portal UI: 99.5%
Authentication API: 98.0%
Backend Service: 97.0%
The Group node will display the average uptime (for example, 98.1%) and show a single health indicator representing this combined view.
The individual nodes can still be inspected directly from the Domain Tree, but the Group node provides a consolidated overview of the entire section.
This is especially useful in:
Microservice architectures,
Cases where multiple nodes contribute to the same workflow,
Situations where management requires a simplified, high-level view.
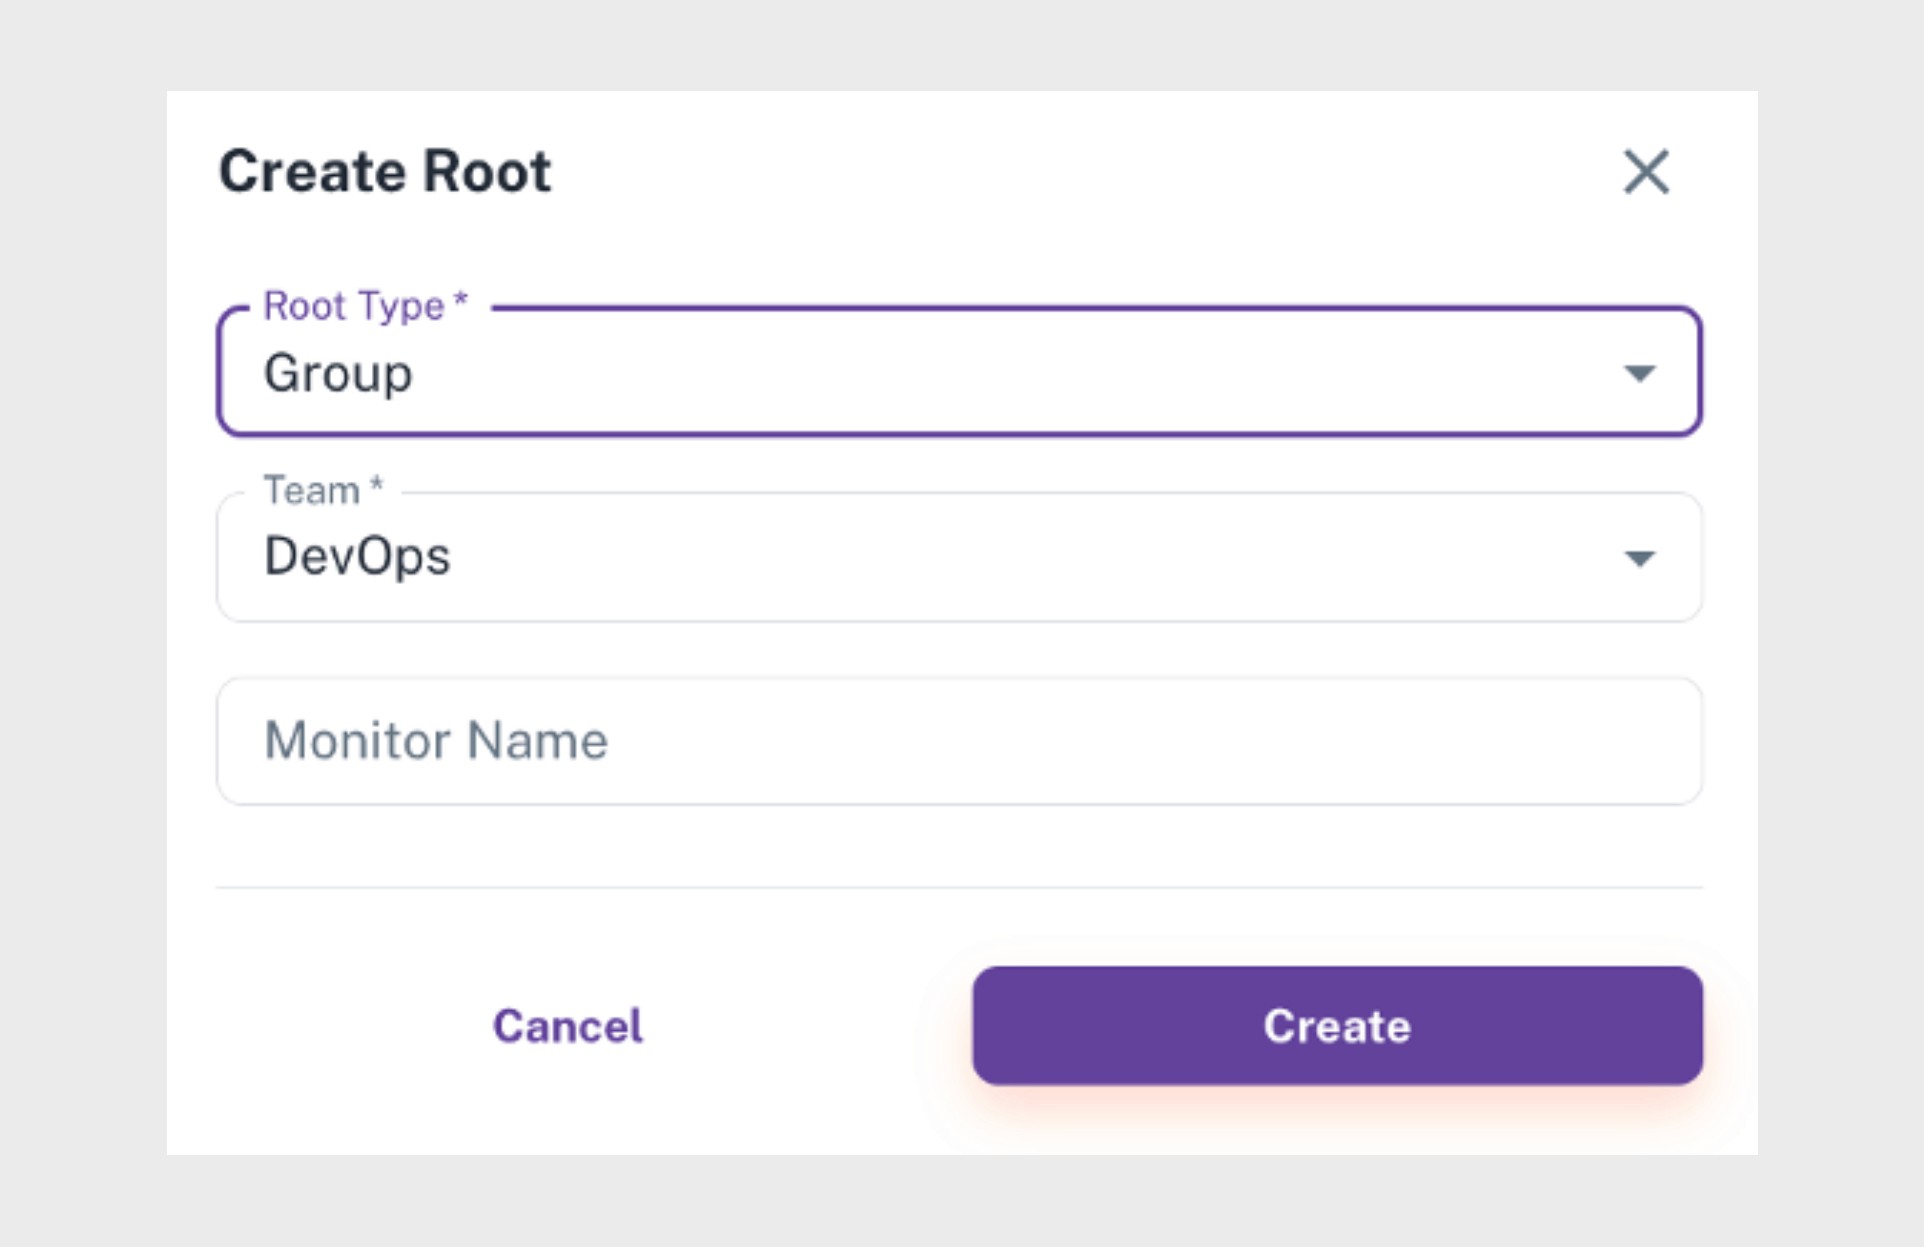
Field | Description |
|---|---|
Root Type | Group is selected. The node acts as a logical parent with no direct checks. |
Team | The team responsible for this group. Alerts are delivered to this team if the group is affected. |
Monitor Name | Display name of the Group node. Examples: User Journey, Payment Stack, Reporting Tier. |
Recommended usage:
Group monitoring is especially useful in scenarios where a higher-level perspective is required. It provides a simplified view by aggregating multiple nodes under a single structure and highlighting their overall health.
It is particularly effective when:
You need a workflow-level overview
e.g. Sign-Up Flow, Payment Completion, Reporting PipelineMultiple nodes belong to the same functional domain
e.g. Auth API, User API, Profile ServiceLeadership or product teams require a concise, high-level dashboard instead of reviewing individual node states
Group nodes reduce visual noise and help teams quickly assess whether a complete section of the system is healthy.
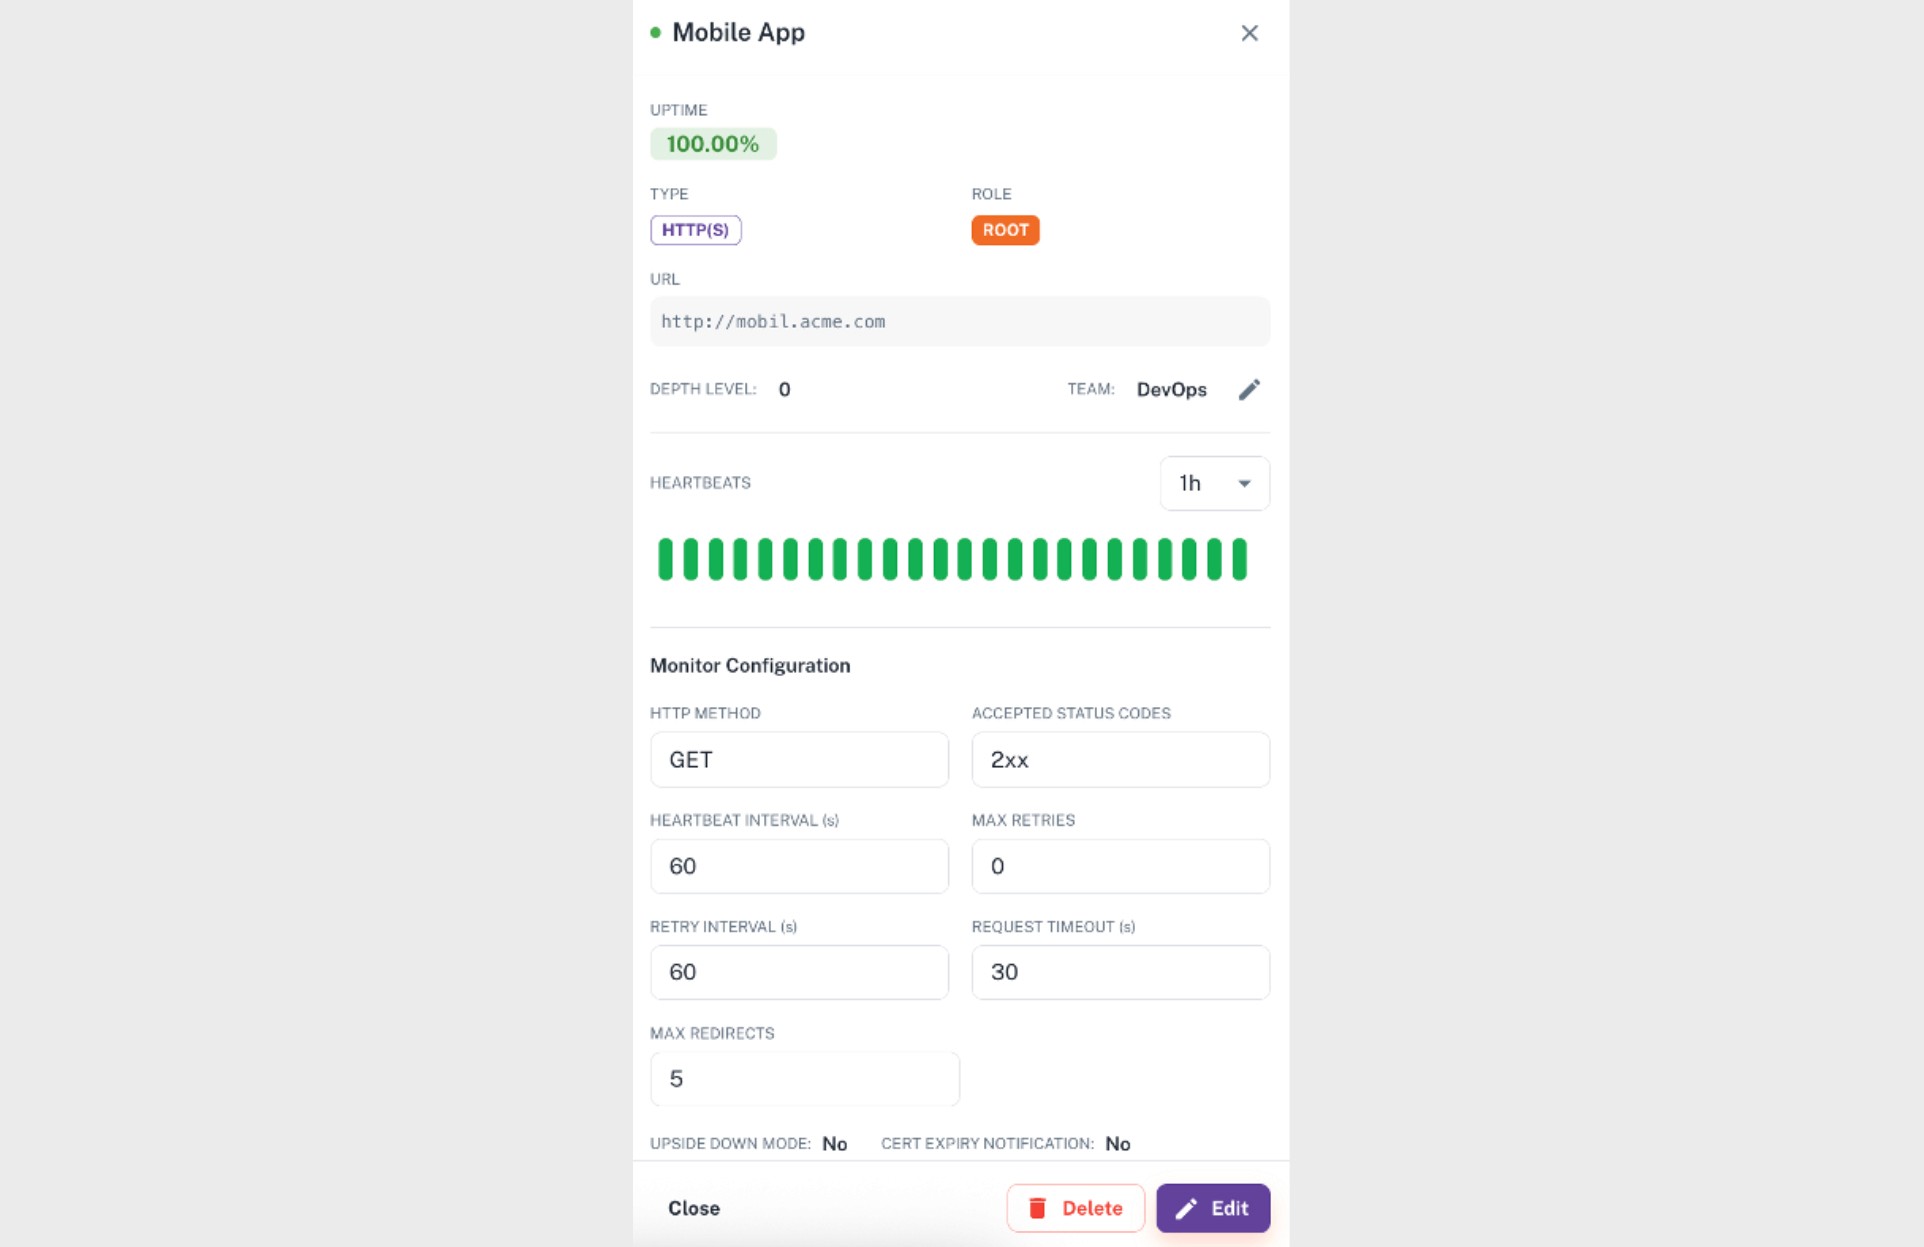
Node Details View
The Node Details View displays the current state of a node and its monitoring configuration. When you select a node in the Domain Tree, this panel opens and presents:
real-time status and health indicators
recently collected monitoring results
configuration parameters such as intervals, retries, and accepted status codes
This view allows you to examine how the node is monitored and diagnose issues without leaving the Domain Tree.
Field | Description |
|---|---|
Uptime | The node’s success rate within the selected time range. |
Type (HTTP(S) / Push / Group) | Shows how the node is monitored. HTTP(S) means external checks, Push means incoming signals, Group means aggregated child nodes. |
Role (Root / Leaf) | Indicates whether the node is a top-level component or a dependent component within the hierarchy. |
URL | The HTTP(S) target that Parny checks, or the endpoint where push signals are received. (Empty for Group nodes.) |
Depth Level | The node’s position in the Domain Tree hierarchy (0 represents the root level). |
Team | The responsible team. Alerts generated for this node are delivered to this team. |
HTTP Method | Request method used by Parny (GET, POST, PUT, PATCH, DELETE, HEAD, OPTIONS). |
Accepted Status Codes | The HTTP status codes considered successful (for example: 2xx, 200, 3xx). |
Heartbeat Interval (s) | How frequently Parny checks this node or expects push signals. |
Max Retries | Number of retry attempts after a failed check. |
Retry Interval (s) | Delay between retry attempts. |
Request Timeout (s) | Maximum time Parny waits for a response before marking the request as failed. |
Max Redirects | Number of redirect hops Parny will follow for HTTP(S) checks. |
Upside Down Mode | Reverses the logic for determining up/down states, useful in special validation scenarios. |
Notify on Certificate Expiry | Sends a warning when the SSL certificate is approaching expiration. |
Heartbeats (Timeline) | A visual timeline of up/down results (green/red bars) showing when the node was healthy, unstable or down. Helps identify when an incident started and whether the node is flapping. |
Table View
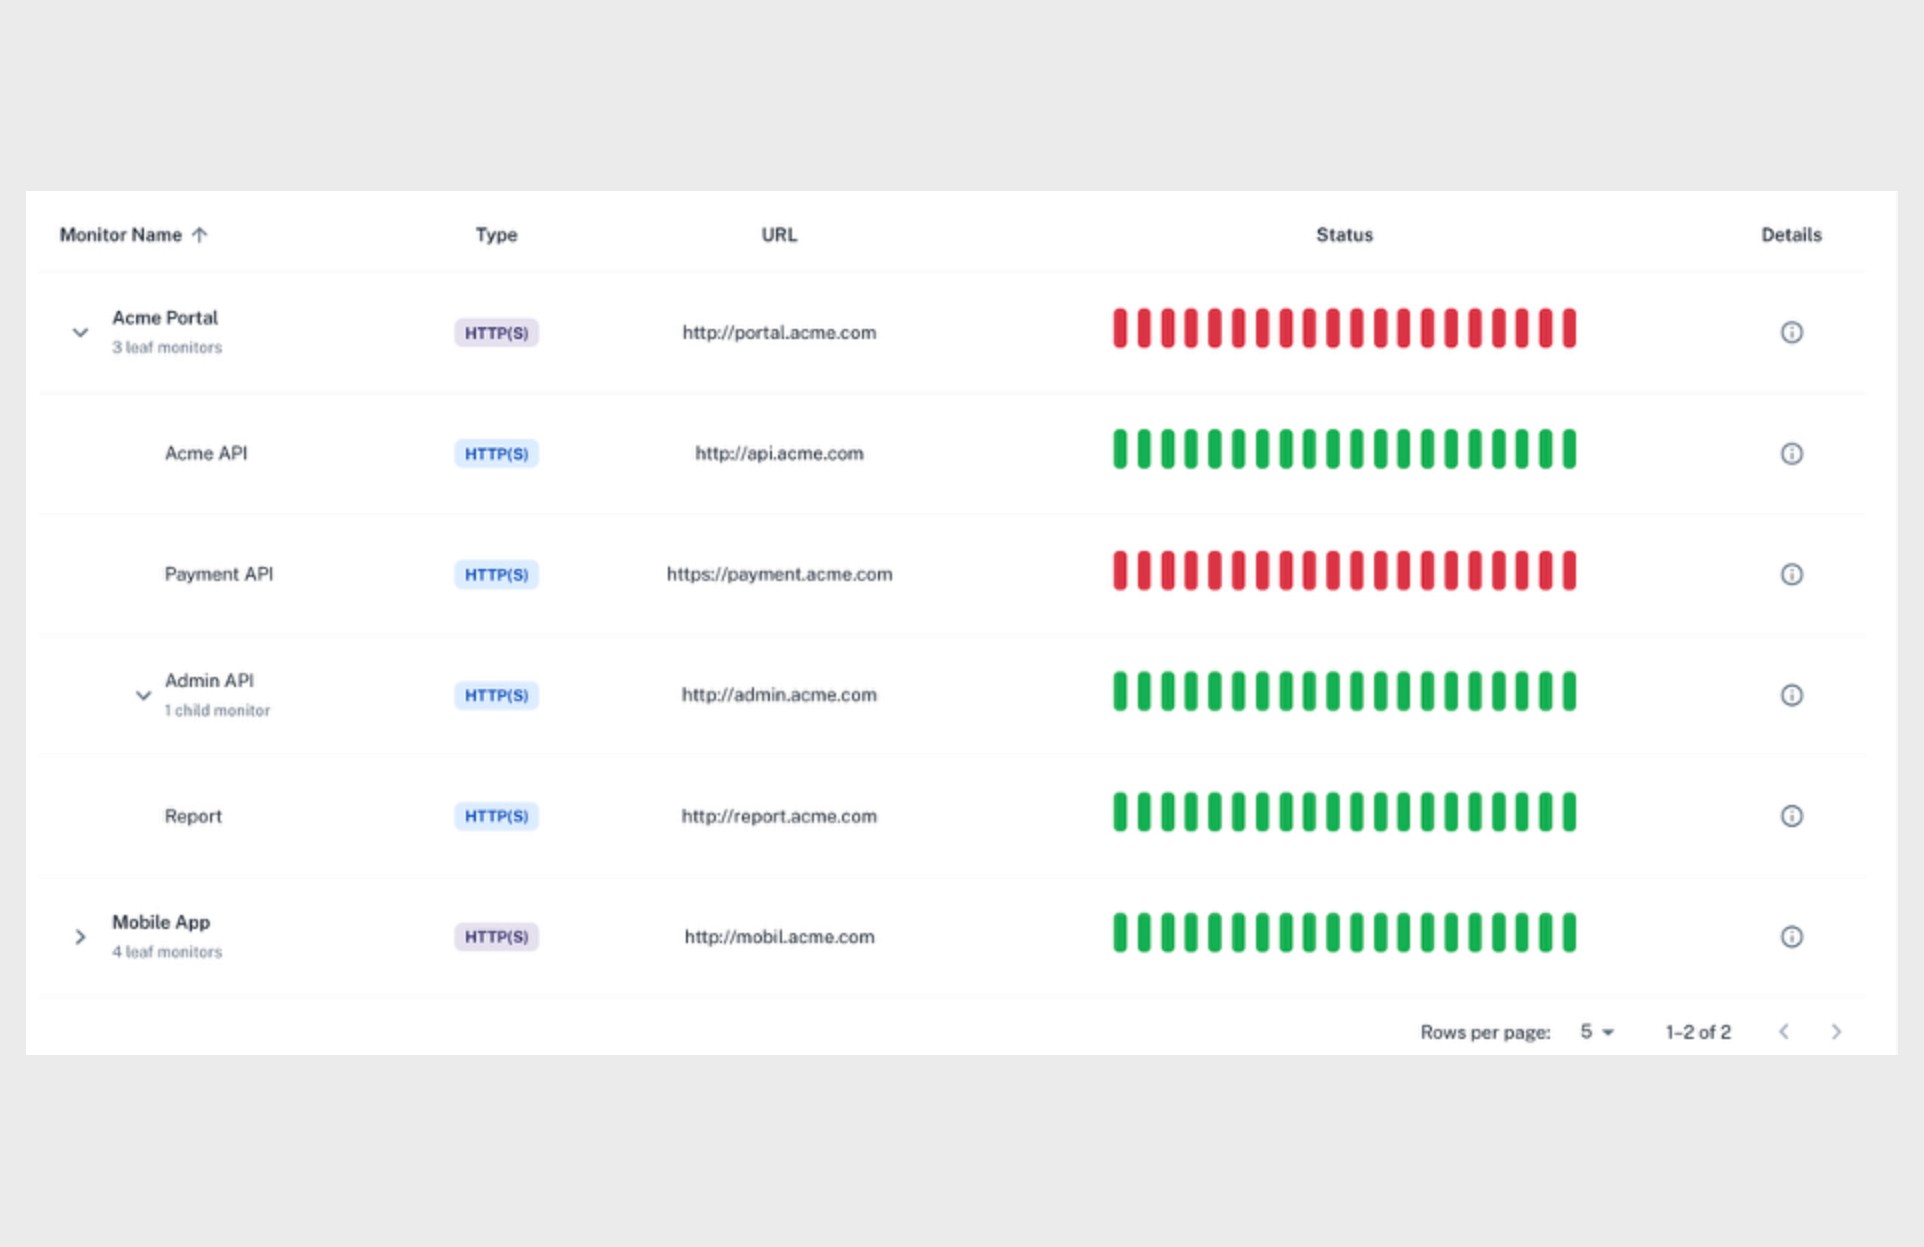
The Table View provides a compact list-based representation of all nodes within the Domain Tree. It is particularly useful in large environments where visually navigating the full tree becomes inefficient. This view allows users to quickly filter, sort and compare node statuses, enabling faster analysis and decision-making.
Field | Description |
|---|---|
Monitor Name | The name of the node. If it has dependent nodes, the row can be expanded or collapsed. |
Type | Indicates the monitoring method: HTTP(S), Push or Group. Helps you quickly understand how the node is being checked. |
URL | The endpoint used for HTTP(S) checks. This field is empty for Push and Group nodes. |
Status (Heartbeats) | A color-coded bar showing all up/down results within the selected timeframe. Green means up, red means down. |
Details | Opens the Node Detail View, where you can see configuration parameters and uptime history. |
Timeframe (15m / 1h / 1d / 1w) | Lets you switch the visible heartbeat window to analyze short-term incidents or longer-term stability trends. |
The Table View is ideal for:
Quickly scanning a large number of nodes
Identifying which endpoints fail frequently
Detecting nodes that are flapping
Reviewing all leaf nodes under a root without navigating the tree
Jumping directly into the detail panel with a single click
The Table View becomes especially valuable in large environments where the Domain Tree can grow dense and visually complex. Instead of expanding multiple branches, you can access all nodes in a clean, filterable list, making comparison and troubleshooting significantly faster.
By combining the visual hierarchy of the Domain Tree with the technical depth of the Node Detail View and the efficiency of the Table View, teams gain a clearer and more actionable understanding of their system’s overall health.